Tag Archives: sklearn
Machine Learning Sklearn Pipeline – Python Example
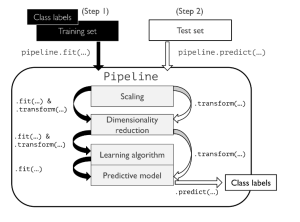
In this post, you will learning about concepts about machine learning (ML) pipeline and how to build ML pipeline using Python Sklearn Pipeline (sklearn.pipeline) package. Getting to know how to use Sklearn.pipeline effectively for training/testing machine learning models will help automate various different activities such as feature scaling, feature selection / extraction and training/testing the models. It is recommended for data scientists (Python) to get a good understanding of Sklearn.pipeline. Introduction to Machine Learning Pipeline & Sklearn.pipeline Machine Learning (ML) pipeline, theoretically, represents different steps including data transformation and prediction through which data passes. The outcome of the pipeline is the trained model which can be used for making the predictions. …
Sklearn SimpleImputer Example – Impute Missing Data
In this post, you will learn about how to use Python’s Sklearn SimpleImputer for imputing / replacing numerical & categorical missing data using different strategies. In one of the related article posted sometime back, the usage of fillna method of Pandas DataFrame is discussed. Handling missing values is key part of data preprocessing and hence, it is of utmost importance for data scientists / machine learning Engineers to learn different techniques in relation imputing / replacing numerical or categorical missing values with appropriate value based on appropriate strategies. SimpleImputer Python Code Example SimpleImputer is a class in the sklearn.impute module that can be used to replace missing values in a dataset, using a …
Elbow Method vs Silhouette Score – Which is Better?
In K-means clustering, elbow method and silhouette analysis or score techniques are used to find the number of clusters in a dataset. The elbow method is used to find the “elbow” point, where adding additional data samples does not change cluster membership much. Silhouette score determines whether there are large gaps between each sample and all other samples within the same cluster or across different clusters. In this post, you will learn about these two different methods to use for finding optimal number of clusters in K-means clustering. Selecting optimal number of clusters is key to applying clustering algorithm to the dataset. As a data scientist, knowing these two techniques to find …
Gradient Boosting Regression Python Examples
In this post, you will learn about the concepts of Gradient Boosting Regression with the help of Python Sklearn code example. Gradient Boosting algorithm is one of the key boosting machine learning algorithms apart from AdaBoost and XGBoost. What is Gradient Boosting Regression? Gradient Boosting algorithm is used to generate an ensemble model by combining the weak learners or weak predictive models. Gradient boosting algorithm can be used to train models for both regression and classification problem. Gradient Boosting Regression algorithm is used to fit the model which predicts the continuous value. Gradient boosting builds an additive mode by using multiple decision trees of fixed size as weak learners or …
Python Sklearn – How to Generate Random Datasets
In this post, you will learn about some useful random datasets generators provided by Python Sklearn. There are many methods provided as part of Sklearn.datasets package. In this post, we will take the most common ones such as some of the following which could be used for creating data sets for doing proof-of-concepts solution for regression, classification and clustering machine learning algorithms. As data scientists, you must get familiar with these methods in order to quickly create the datasets for training models using different machine learning algorithms. Methods for generating datasets for Classification Methods for generating datasets for Regression Methods for Generating Datasets for Classification The following is the list of …
RANSAC Regression Explained with Python Examples
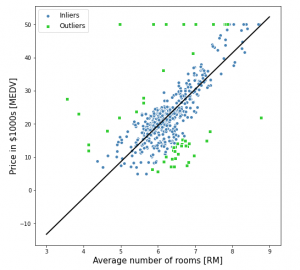
In this post, you will learn about the concepts of RANSAC regression algorithm along with Python Sklearn example for RANSAC regression implementation using RANSACRegressor. RANSAC regression algorithm is useful for handling the outliers dataset. Instead of taking care of outliers using statistical and other techniques, one can use RANSAC regression algorithm which takes care of the outlier data. In this post, the following topics are covered: Introduction to RANSAC regression RANSAC Regression Python code example Introduction to RANSAC Regression RANSAC (RANdom SAmple Consensus) algorithm takes linear regression algorithm to the next level by excluding the outliers in the training dataset. The presence of outliers in the training dataset does impact …
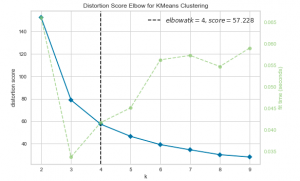
K-means Clustering Elbow Method & SSE Plot – Python
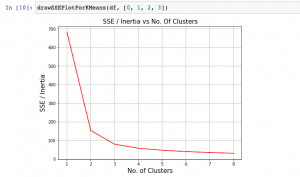
In this plot, you will quickly learn about how to find elbow point using SSE or Inertia plot with Python code and You may want to check out my blog on K-means clustering explained with Python example. The following topics get covered in this post: What is Elbow Method? How to create SSE / Inertia plot? How to find Elbow point using SSE Plot What is Elbow Method? Elbow method is one of the most popular method used to select the optimal number of clusters by fitting the model with a range of values for K in K-means algorithm. Elbow method requires drawing a line plot between SSE (Sum of Squared errors) …
Adaboost Algorithm Explained with Python Example
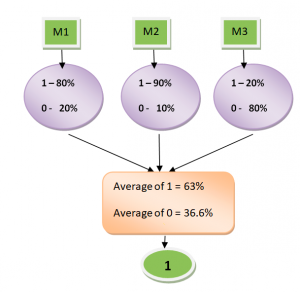
In this post, you will learn about boosting technique and adaboost algorithm with the help of Python example. You will also learn about the concept of boosting in general. Boosting classifiers are a class of ensemble-based machine learning algorithms which helps in variance reduction. It is very important for you as data scientist to learn both bagging and boosting techniques for solving classification problems. Check my post on bagging – Bagging Classifier explained with Python example for learning more about bagging technique. The following represents some of the topics covered in this post: What is Boosting and Adaboost Algorithm? Adaboost algorithm Python example What is Boosting and Adaboost Algorithm? As …
Hard vs Soft Voting Classifier Python Example
In this post, you will learn about one of the popular and powerful ensemble classifier called as Voting Classifier using Python Sklearn example. Voting classifier comes with multiple voting options such as hard and soft voting options. Hard vs Soft Voting classifier is illustrated with code examples. The following topic has been covered in this post: Voting classifier – Hard vs Soft voting options Voting classifier Python example Voting Classifier – Hard vs Soft Voting Options Voting Classifier is an estimator that combines models representing different classification algorithms associated with individual weights for confidence. The Voting classifier estimator built by combining different classification models turns out to be stronger meta-classifier that balances out the individual …
Python – Nested Cross Validation for Algorithm Selection
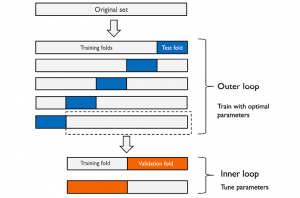
In this post, you will learn about nested cross validation technique and how you could use it for selecting the most optimal algorithm out of two or more algorithms used to train machine learning model. The usage of nested cross validation technique is illustrated using Python Sklearn example. When it is about selecting models trained with a particular algorithm with most optimal combination of hyper parameters, you can adopt the model tuning techniques such as some of the following: Grid search Randomized search Validation curve The following topics get covered in this post: Why nested cross-validation? Nested cross-validation with Python Sklearn example Why Nested Cross-Validation? Nested cross-validation technique is used for estimating …
Randomized Search Explained – Python Sklearn Example
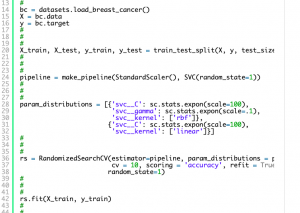
In this post, you will learn about one of the machine learning model tuning technique called Randomized Search which is used to find the most optimal combination of hyper parameters for coming up with the best model. The randomized search concept will be illustrated using Python Sklearn code example. As a data scientist, you must learn some of these model tuning techniques to come up with most optimal models. You may want to check some of the other posts on tuning model parameters such as the following: Sklearn validation_curve for tuning model hyper parameters Sklearn GridSearchCV for tuning model hyper parameters In this post, the following topics will be covered: What and why …
Grid Search Explained – Python Sklearn Examples
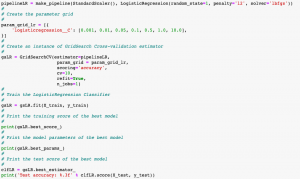
In this post, you will learn about another machine learning model hyperparameter optimization technique called as Grid Search with the help of Python Sklearn code examples. In one of the earlier posts, you learned about another hyperparamater optimization technique namely validation curve. As a data scientist, it will be useful to learn some of these model tuning techniques (tuning hyperparameters) as it would help us select most appropriate models with most appropriate parameters. The following are some of the topics covered in this post: What & Why of grid search? Grid search with Python Sklearn examples What & Why of Grid Search? Grid Search technique helps in performing exhaustive search over specified parameter (hyper parameters) values for …
Validation Curves Explained – Python Sklearn Example
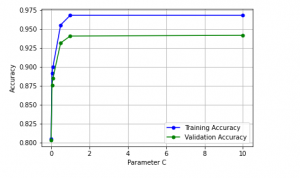
In this post, you will learn about validation curves with Python Sklearn example. You will learn about how validation curves can help diagnose or assess your machine learning models in relation to underfitting and overfitting. On the similar topic, I recommend you reading one of the previous post on assessing overfitting and underfitting titled Learning curves explained with Python Sklearn example. The following gets covered in this post: Why validation curves? Python Sklearn example for validation curves Why Validation Curves? As like learning curve, the validation curve also helps in diagnozing the model bias vs variance. The validation curve plot helps in selecting most appropriate model parameters (hyper-parameters). Unlike learning …
What, When & How of Scatterplot Matrix in Python
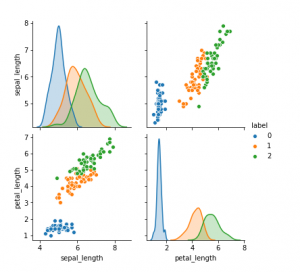
In this post, you will learn about some of the following in relation to scatterplot matrix. Note that scatter plot matrix can also be termed as pairplot. Later in this post, you would find Python code example in relation to using scatterplot matrix / pairplot (seaborn package). What is scatterplot matrix? When to use scatterplot matrix / pairplot? How to use scatterplot matrix in Python? What is Scatterplot Matrix? Scatter plot matrix is a matrix (or grid) of scatter plots where each scatter plot in the grid is created between different combinations of variables. In other words, scatter plot matrix represents bi-variate or pairwise relationship between different combinations of variables …
I found it very helpful. However the differences are not too understandable for me