
In this plot, you will quickly learn about how to find elbow point using SSE or Inertia plot with Python code and You may want to check out my blog on K-means clustering explained with Python example. The following topics get covered in this post:
- What is Elbow Method?
- How to create SSE / Inertia plot?
- How to find Elbow point using SSE Plot
What is Elbow Method?
Elbow method is one of the most popular method used to select the optimal number of clusters by fitting the model with a range of values for K in K-means algorithm. Elbow method requires drawing a line plot between SSE (Sum of Squared errors) vs number of clusters and finding the point representing the “elbow point” (the point after which the SSE or inertia starts decreasing in a linear fashion). Here is the sample elbow point. In the later sections, it is illustrated as to how to draw the line plot and find elbow point.
How to Draw SSE / Inertia Plot
In order to find elbow point, you will need to draw SSE or inertia plot. In this section, you will see a custom Python function, drawSSEPlotForKMeans, which can be used to create the SSE (Sum of Squared Error) or Inertia plot representing SSE value on Y-axis and Number of clusters on X-axis. SSE is also called within-cluster SSE plot. Pay attention to some of the following function parameters which need to be passed to the method, drawSSEPlotForKMeans

- df: Pandas dataframe consisting of the data
- column_indices: Column indices representing the features in the dataframe.
- n_clusters (default as 8): Number of clusters
- init (default as k-means++): Represents method for initialization. The default value of k-means++ represents the selection of the initial cluster centers (centroids) in a smart manner to speed up the convergence. The other values of init can be random, which represents the selection of n_clusters observations at random from data for the initial centroids.
- n_init (default as 10): Represents the number of time the k-means algorithm will be run independently, with different random centroids in order to choose the final model as the one with the lowest SSE.
- max_iter (default as 300): Represents the maximum number of iterations for each run. The iteration stops after the maximum number of iterations is reached even if the convergence criterion is not satisfied. This number must be between 1 and 999. In this paper (Scalable K-Means by ranked retrieval), the authors stated that K-means converges after 20-50 iterations in all practical situations, even on high dimensional datasets as they tested.
- tol (default as 1e-04): Tolerance value is used to check if the error is greater than the tolerance value. For error greater than tolerance value, K-means algorithm is run until the error falls below the tolerance value which implies that the algorithm has converged.
- algorithm (default as auto): Represents the type of K-means algorithm to use. The different values that algorithm can take is auto, full and elkan. The classical EM-style algorithm is full. The elkan variation is more efficient on data with well-defined clusters
def drawSSEPlot(df, column_indices, n_clusters=8, max_iter=300, tol=1e-04, init='k-means++', n_init=10, algorithm='auto'):
    import matplotlib.pyplot as plt
    inertia_values = []
    for i in range(1, n_clusters+1):
        km = KMeans(n_clusters=i, max_iter=max_iter, tol=tol, init=init, n_init=n_init, random_state=1, algorithm=algorithm)
        km.fit_predict(df.iloc[:, column_indices])
        inertia_values.append(km.inertia_)
    fig, ax = plt.subplots(figsize=(8, 6))
    plt.plot(range(1, n_clusters+1), inertia_values, color='red')
    plt.xlabel('No. of Clusters', fontsize=15)
    plt.ylabel('SSE / Inertia', fontsize=15)
    plt.title('SSE / Inertia vs No. Of Clusters', fontsize=15)
    plt.grid()
    plt.show()
The following illustrates how the above function can be invoked to draw SSE or inertia plot. The Sklearn IRIS dataset is used for illustration purpose.
import pandas as pd
from sklearn.cluster import KMeans
from sklearn import datasets

iris = datasets.load_iris()
X = iris.data
y = iris.target

df = pd.DataFrame(X)
df.columns = ['sepal_length', 'sepal_width', 'petal_length', 'petal_width']
df['target'] = y
Here is the code representing how SSE / inertia plot will be invoked:
drawSSEPlotForKMeans(df, [0, 1, 2, 3])
Here is how the inertia / SSE plot would look like:
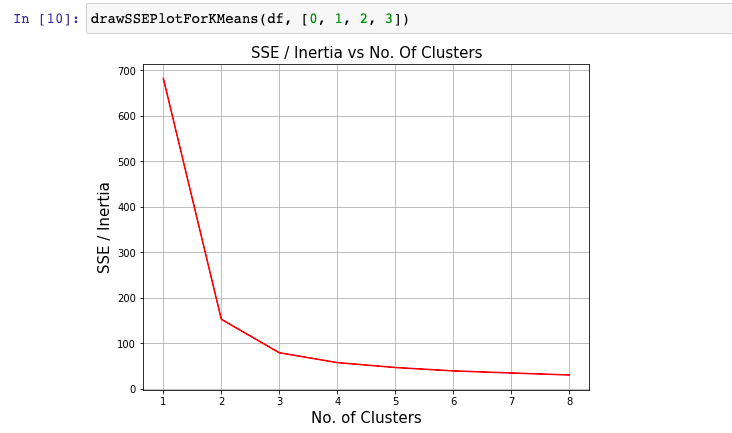
How to find Elbow point using SSE Plot
The elbow point represents the point in the SSE / Inertia plot where SSE or inertia starts decreasing in a linear manner. In the fig 2, you may note that it is no. of clusters = 3 where the SSE starts decreasing in the linear manner.
Conclusions
Here is the summary of what you learned in this post related to finding elbow point using elbow method which includes drawing SSE / Inertia plot:
- Elbow method is used to determine the most optimal value of K representing number of clusters in K-means clustering algorithm.
- Elbow method requires drawing a line plot between SSE (Within-clusters Sum of Squared errors) vs number of clusters.
- In the line plot, the point at this the SSE or inertia values start decreasing in a linear manner is called as elbow point.

Check out my latest book titled as First Principles Thinking: Building winning products using first principles thinking.
- Mathematics Topics for Machine Learning Beginners - July 6, 2025
- Questions to Ask When Thinking Like a Product Leader - July 3, 2025
- Three Approaches to Creating AI Agents: Code Examples - June 27, 2025
What a great article sir. this is what i was looking for.
Thank you Shubham
Hello
Thanks for the explanation, but i had a question.
what is [0, 1, 2, 3] referred to in the function?
drawSSEPlotForKMeans(df, [0, 1, 2, 3])