
In K-means clustering, elbow method and silhouette analysis or score techniques are used to find the number of clusters in a dataset. The elbow method is used to find the “elbow” point, where adding additional data samples does not change cluster membership much. Silhouette score determines whether there are large gaps between each sample and all other samples within the same cluster or across different clusters. In this post, you will learn about these two different methods to use for finding optimal number of clusters in K-means clustering. Selecting optimal number of clusters is key to applying clustering algorithm to the dataset. As a data scientist, knowing these two techniques to find out optimal number of clusters would prove to be very helpful while In this relation, you may want to check out detailed posts on the following:
- K-means clustering elbow method and SSE plot
- K-means Silhouette score explained with Python examples
In this post, we will use YellowBricks machine learning visualization library for creating the plot related to Elbow method and Silhouette score. The following topics get covered in this post:
- Elbow method plot vs Silhouette analysis plot
- Which method to use – Elbow method vs Silhouette score
Elbow Method / SSE Plot vs Silhouette Analysis Plot
In this section, you will learn about how to create an SSE Plot and Silhouette plot for determining the optimal number of clusters in K-means clustering. Recall that SSE represents the within-cluster sum of square error calculated using Euclidean distance.
The Elbow method is used to find the elbow in the elbow plot. The elbow is found when the dataset becomes flat or linear after applying the cluster analysis algorithm. The elbow plot shows the elbow at the point where the number of clusters starts increasing.
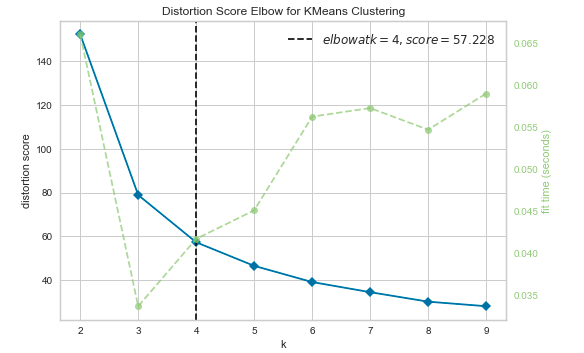
Here is the Python code using YellowBricks library for Elbow method / SSE Plot created using SKLearn IRIS dataset. In the Elbow method where an SSE line plot is drawn, if the line chart looks like an arm, then the “elbow” on the arm is the value of k that is the best.
from sklearn import datasets
from sklearn.cluster import KMeans
from yellowbrick.cluster import KElbowVisualizer
#
# Load the IRIS dataset
#
iris = datasets.load_iris()
X = iris.data
y = iris.target
#
# Instantiate the clustering model and visualizer
#
km = KMeans(random_state=42)
visualizer = KElbowVisualizer(km, k=(2,10))

visualizer.fit(X)        # Fit the data to the visualizer
visualizer.show()        # Finalize and render the figure
Here is how the Elbow / SSE Plot would look like. As per the plot given below, for n_clusters = 4 that represents the elbow you start seeing diminishing returns by increasing k. The line starts looking linear.
The silhouette score of a point measures how close that point lies to its nearest neighbor points, across all clusters. It provides information about clustering quality which can be used to determine whether further refinement by clustering should be performed on the current clustering. Here is the Python code using YellowBricks library for Silhouette analysis/plots:
from sklearn import datasets
from sklearn.cluster import KMeans
import matplotlib.pyplot as plt
from yellowbrick.cluster import SilhouetteVisualizer
#
# Load the IRIS dataset
#
iris = datasets.load_iris()
X = iris.data
y = iris.target

fig, ax = plt.subplots(3, 2, figsize=(15,8))
for i in [2, 3, 4, 5, 6, 7]:
    '''
    Create KMeans instance for different number of clusters
    '''
    km = KMeans(n_clusters=i, init='k-means++', n_init=10, max_iter=100, random_state=42)
    q, mod = divmod(i, 2)
    '''
    Create SilhouetteVisualizer instance with KMeans instance
    Fit the visualizer
    '''
    visualizer = SilhouetteVisualizer(km, colors='yellowbrick', ax=ax[q-1][mod])
    visualizer.fit(X)
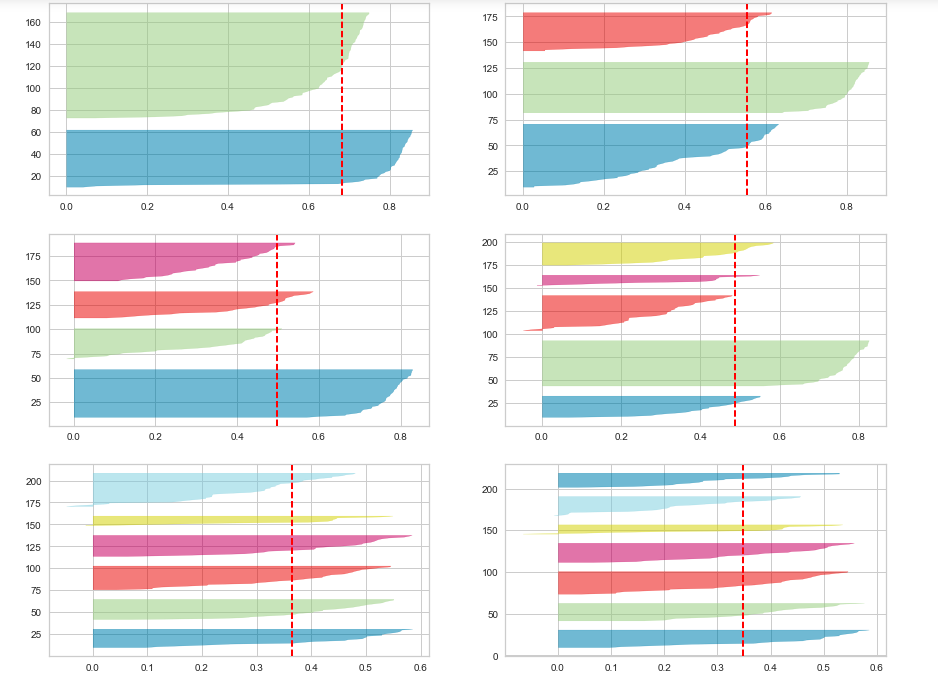
Here is how the Silhouette plot would look like for different numbers of clusters ranging from 2 to 7 clusters.
Which technique to use – Elbow method vs Silhouette Score
While the elbow method and silhouette score provide information on different aspects, both provide valuable information for clustering analysis. Both the Elbow method / SSE Plot and the Silhouette method can be used interchangeably based on the details presented by the plots. It may be a good idea to use both plots just to make sure that you select the most optimal number of clusters. While both provide valuable information for clustering analysis elbow method is easy to implement and provides valuable results.
The major difference between elbow and silhouette scores is that elbow only calculates the euclidean distance whereas silhouette takes into account variables such as variance, skewness, high-low differences, etc. The calculation simplicity of elbow makes it more suited than silhouette score for datasets with smaller size or time complexity. In the Elbow method where an SSE line plot is drawn, if the line chart looks like an arm, then the “elbow” on the arm is the value of k that is the best. It is the point, from where the decrease in SSE starts looking linear.
Silhouette analysis/scores and related Silhouette plots look to have an edge over elbow method as one can evaluate clusters on multiple criteria such as the following and it is highly likely that one can end up determining the most optimal number of clusters in K-means. The Silhouette plots shown below have been created on the Sklearn IRIS dataset.
- Whether all the clusters’ Silhouette plot falls beyond the average Silhouette score. If the silhouette plot for one of the clusters fall below the average Silhouette score, one can reject those numbers of clusters. Thus, the choice of n_clusters = 4 will be sub-optimal.
- Whether there is wide fluctuations in the size of the cluster plots. If there are wider fluctuations like the following, the number of cluster is sub-optimal. In the diagram below, you could see wide fluctuations with one cluster below average score, other is very large and yet another ones in between. Thus, the choice of n_clusters = 5 will be sub-optimal.
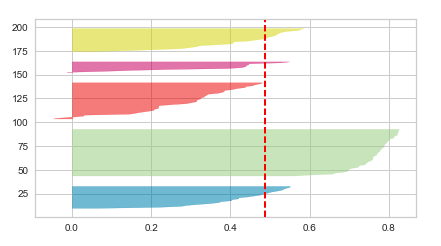
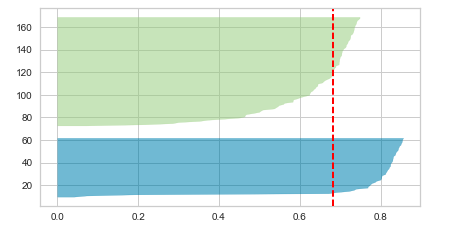
- Whether the thickness of the clusters’ Silhouette plot is uniform. If there are clusters of non-uniform thickness, the number of clusters is sub-optimal. In the diagram below, you will see the two cluster Silhouette plots to have non-uniform thickness, one being very much thicker than another. Thus, the choice of n_clusters = 2 will be sub-optimal.
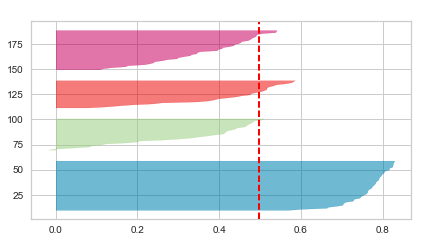
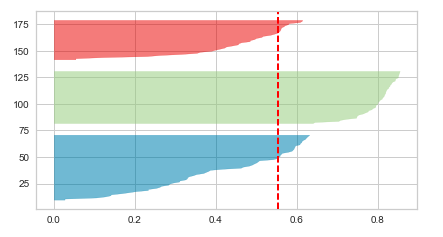
Given above, the Silhouette plot for n_clusters = 3 looks to be most appropriate than others as it stands well against all the three measuring criteria (scores below average Silhouette score, Wide fluctuations in the size of the plot, and non-uniform thickness). Here is how the plot looks like:
Conclusions
Here is the summary of what you learned in relation to which method out of the Elbow method and Silhouette score to use for finding an optimal number of clusters in K-means clustering:
- When using elbow method, look for the point from where the SSE plot starts looking linear. In other words, the decrease in SSE is not much after that point.
- When using Silhouette plot, look for the number of clusters where all clusters’ plot is beyond average Silhouette score, with mostly uniform thickness and do not have wide fluctuations in the size.
- You could as well use both the SSE / Elbow plot and Silhouette plot just to make sure you select the most optimal number of clusters in K-means clustering.
Which technique out of elbow method or silhouette score would you choose? Please leave us your comments below!

Check out my latest book titled as First Principles Thinking: Building winning products using first principles thinking.
- Mathematics Topics for Machine Learning Beginners - July 6, 2025
- Questions to Ask When Thinking Like a Product Leader - July 3, 2025
- Three Approaches to Creating AI Agents: Code Examples - June 27, 2025
I found it very helpful. However the differences are not too understandable for me