Tag Archives: data sci
What, When & How of Scatterplot Matrix in Python
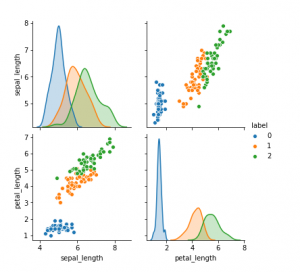
In this post, you will learn about some of the following in relation to scatterplot matrix. Note that scatter plot matrix can also be termed as pairplot. Later in this post, you would find Python code example in relation to using scatterplot matrix / pairplot (seaborn package). What is scatterplot matrix? When to use scatterplot matrix / pairplot? How to use scatterplot matrix in Python? What is Scatterplot Matrix? Scatter plot matrix is a matrix (or grid) of scatter plots where each scatter plot in the grid is created between different combinations of variables. In other words, scatter plot matrix represents bi-variate or pairwise relationship between different combinations of variables …
I found it very helpful. However the differences are not too understandable for me