Tag Archives: Data Science
Clinical Trials & Statistics Use Cases: Examples

Are you a statistician, data scientist or business analyst working in the field of clinical trials? Do you find yourself curious about how statistical analyses play a pivotal role in unlocking valuable actionable insights and driving critical decisions in drug development? If so, in this blog, we will learn about various different use cases where clinical trials and statistics intersect. Clinical trials are the backbone of evidence-based medicine, paving the way for the discovery and development of innovative therapies that can improve patient outcomes. Within this realm, statistics allows researchers and analysts to make sense of complex data, evaluate treatment efficacy, assess safety profiles, and optimize trial design. In this …
Spearman Correlation Coefficient: Formula, Examples
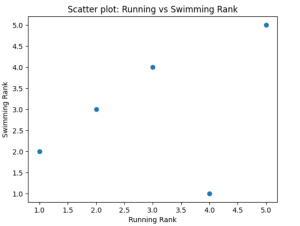
Have you ever wondered how you might determine the relationship between two sets of data that aren’t necessarily linear, or perhaps don’t adhere to the assumptions of other correlation measures? Enter the Spearman Rank Correlation Coefficient, a non-parametric statistic that offers robust insights into the monotonic relationship between two variables – perfect for dealing with ranked variables or exploring potential relationships in a new, exploratory dataset. In this blog post, we will learn the concepts of Spearman correlation coefficient with the help of Python code examples. Understanding the concept can prove to be very helpful for data scientists. Whether you’re exploring associations in marketing data, results from a customer satisfaction …
Heteroskedasticity in Regression Models: Examples
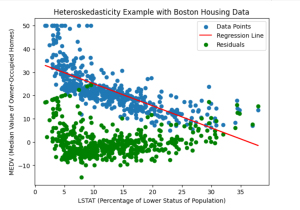
Have you ever encountered data that exhibits varying patterns of dispersion and wondered how it might impact your regression models? The varying patterns of dispersion represents the essence of heteroskedasticity – the phenomenon where the spread or variability of the residuals / errors in a regression model changes across different levels or values of the independent variables. As data scientists, understanding the concept of heteroskedasticity is crucial for robust and accurate analyses. In this blog, we delve into the intriguing world of heteroskedasticity in regression models and explore its implications through real-world examples. What’s heteroskedasticity and why learn this concept? Heteroskedasticity refers to a statistical phenomenon observed in regression analysis, …
Loan Eligibility / Approval & Machine Learning: Examples

It is no secret that the loan industry is a multi-billion dollar industry. Lenders make money by charging interest on loans, and borrowers want to get the best loan terms possible. In order to qualify for a loan, borrowers are typically required to provide information about their income, assets, and credit score. This process can be time consuming and frustrating for both lenders and borrowers. In this blog post, we will discuss how AI / machine learning can be used to predict loan eligibility. As data scientists, it is of great importance to understand some of challenges in relation to loan eligibility and how machine learning models can be built …
Credit Risk Modeling & Machine Learning Use Cases

Have you ever wondered how banks and financial institutions decide who to lend money to, or how much to lend? The secret lies in credit risk modeling, a sophisticated approach that evaluates the likelihood of a borrower defaulting on their loan. Through in-depth analysis of historical data and borrower’s credit behavior, these models play a pivotal role in guiding lending decisions, managing risks, and ultimately, driving profitability. In the face of growing financial complexities, traditional methods are often insufficient. That’s where machine learning comes into play that helps better anticipate credit risk. By automating the identification of patterns within data, patterns that often go unnoticed by human analysis, machine learning …
Matplotlib Bar Chart Python / Pandas Examples
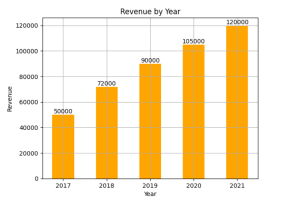
Are you looking to learn how to create bar charts / bar plots / bar graph using the combination of Matplotlib and Pandas in Python? Bar charts are one of the most commonly used visualizations in data analysis, enabling us to present categorical data in a visually appealing and intuitive manner. Whether you’re a beginner data scientist or an intermediate-level practitioner seeking to enhance your visualization skills, this blog will provide you with practical examples and hands-on guidance to create compelling bar charts / bar plots using Matplotlib libraries in Python. You will also learn how to leverage the data manipulation capabilities of Pandas to prepare the data for visualization, …
One-hot Encoding Concepts & Python Examples
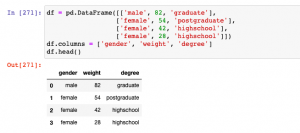
Have you ever encountered categorical variables in your data analysis or machine learning projects? These variables represent discrete qualities or characteristics, such as colors, genders, or types of products. While numerical variables can be directly used as inputs for machine learning algorithms, categorical variables require a different approach. One common technique used to convert categorical variables into a numerical representation is called one-hot encoding, also known as dummy encoding. When working with machine learning algorithms, categorical variables need to be transformed into a numerical representation to be effectively used as inputs. This is where one-hot encoding comes to rescue. In this post, you will learn about One-hot Encoding concepts and …
Ridge Regression Concepts & Python example
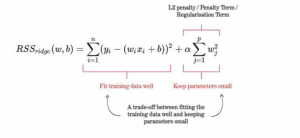
Ridge regression is a type of linear regression that penalizes ridge coefficients. This technique can be used to reduce the effects of multicollinearity in ridge regression, which may result from high correlations among predictors or between predictors and independent variables. In this tutorial, we will explain ridge regression with a Python example. What is Ridge Regression? Ridge regression is a powerful technique in machine learning that addresses the issue of overfitting in linear models. In linear regression, we aim to model the relationship between a response variable and one or more predictor variables. However, when there are multiple variables that are highly correlated, the model can become too complex and …
Machine Learning NPTEL Online Courses List 2023
Machine learning is a rapidly evolving field that has gained immense popularity in recent years. As technology continues to advance, the demand for professionals with expertise in machine learning continues to soar. If you’re someone who is interested in diving deep into the world of machine learning or looking to enhance your existing knowledge, the NPTel courses are an excellent avenue to explore. The National Programme on Technology Enhanced Learning (NPTel) is a joint initiative by the Indian Institutes of Technology (IITs) and the Indian Institute of Science (IISc). It offers a wide range of online courses across various disciplines, including computer science and engineering. In this blog, we will …
Online US Degree Courses & Programs in AI / Machine Learning
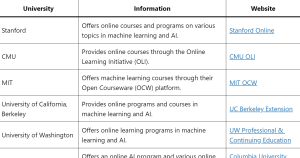
Data Science & AI / Machine learning has emerged as a transformative field, revolutionizing industries and shaping the future of technology. As the demand for professionals skilled in machine learning continues to rise, top universities in the United States (USA) have recognized the need to offer online degree courses and programs in this dynamic field. Through these online offerings, students can now access world-class education and earn prestigious degrees from the comfort of their own homes, while benefiting from the expertise of renowned faculty members. In this blog post, we present a curated list of leading US universities that provide online degree courses and programs in machine learning. Whether you …
Binomial Distribution Explained with Examples
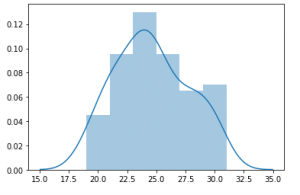
Have you ever wondered how to predict the number of successes in a series of independent trials? Or perhaps you’ve been curious about the probability of achieving a specific outcome in a sequence of yes-or-no questions. If so, we are essentially talking about the binomial distribution. It’s important for data scientists to understand this concept as binomials are used often in business applications. The binomial distribution is a discrete probability distribution that applies to binomial experiments (experiments with binary outcomes). It’s the number of successes in a specific number of trials. Sighting a simple yet real-life example, the binomial distribution may be imagined as the probability distribution of a number …
Difference between Data Science & Data Analytics
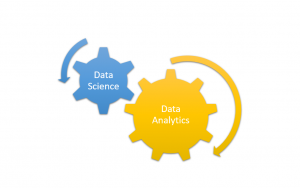
What’s the difference between data science and data analytics? Many people use these terms interchangeably, but there is a big distinction between the two fields. Data science is more focused on understanding and deriving insights from data while leveraging statistical and machine learning methods, while data analytics is an overarching term used to solve problems using analytical techniques while leveraging data. Both the terms are in a way related. In this blog post, we’ll explore the differences between data science and data analytics in greater detail, with examples of each. The following are key topics in relation to the difference between data science and data analytics: Different forms/purposes Different techniques …
Hold-out Method for Training Machine Learning Models
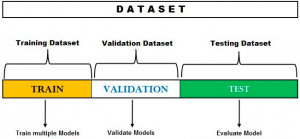
The hold-out method for training the machine learning models is a technique that involves splitting the data into different sets: one set for training, and other sets for validation and testing. The hold-out method is used to check how well a machine learning model will perform on the new data. In this post, you will learn about the hold-out method used during the process of training the machine learning model. Do check out my post on what is machine learning? concepts & examples for a detailed understanding of different aspects related to the basics of machine learning. Also, check out a related post on what is data science? When evaluating …
One-way ANOVA test: Concepts, Formula & Examples
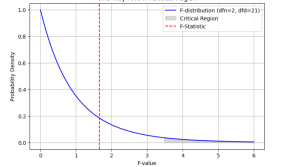
The one-way analysis of variance (ANOVA) test is a statistical procedure commonly used to compare the means values on a specific variable between three or more groups. The significance of the difference between the means of two samples can be judged through either t-test or z-test depending upon different criteria, but it becomes tricky when there is a need to simultaneously evaluate the significance of the difference amongst three or more sample means. This is where one-way ANOVA test comes to rescue. The ANOVA technique enables us to perform this simultaneous test and as such is considered to be an important tool of analysis. As data scientists, it is of …
Neyman-Pearson Lemma: Hypothesis Test, Examples
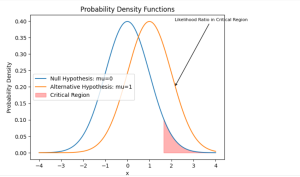
Have you ever faced a crucial decision where you needed to rely on data to guide your choice? Whether it’s determining the effectiveness of a new medical treatment or assessing the quality of a manufacturing process, hypothesis testing becomes essential. That’s where the Neyman-Pearson Lemma steps in, offering a powerful framework for making informed decisions based on statistical evidence. The Neyman-Pearson Lemma holds immense importance when it comes to solving problems that demand decision making or conclusions to a higher accuracy. By understanding this concept, we learn to navigate the complexities of hypothesis testing, ensuring we make the best choices with greater confidence. In this blog post, we will explore …
Pandas CSV to Dataframe Python Example
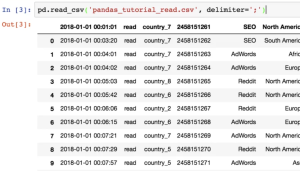
Converting CSV files to DataFrames is a common task in data analysis. In this blog, we’ll explore a Python code example using the Pandas library to efficiently convert CSV files to DataFrames. This approach offers flexibility, speed, and convenience, making it a valuable technique for handling large datasets. Read CSV into Pandas Dataframe The following is the code which can be used to read the CSV file from local drive: In case, you want to read CSV file from the URL, the following will be the code. As a matter of fact, nothing changes except for the fact that you pass the URL to read_csv function. The following are some …

I found it very helpful. However the differences are not too understandable for me