First Principles Thinking Explained with Examples

Last updated: 23rd Jan, 2024 Can innovation be taught and learned methodically? Can there be an innovation playbook using which, given a need to create a thing, product, or solve a complex problem, a set of well-defined steps be followed? How has Elon Musk been super successful time and again in creating game-changing innovative products that created tremendous value for end-users and society at large? The answers to these questions can be found with a reasoning technique called first principles thinking. The first principles thinking is often associated with Elon Musk, who uses this approach to come up with his business ideas, create innovative product designs, and build winning products …
Transfer Learning vs Fine Tuning LLMs: Differences
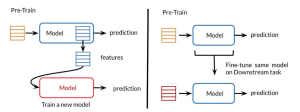
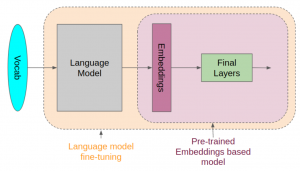
Last updated: 23rd Jan, 2024 Two NLP concepts that are fundamental to large language models (LLMs) are transfer learning and fine-tuning pre-trained LLMs. Rather, true fine-tuning can also be termed as full fine-tuning because transfer learning is also a form of fine-tuning. Despite their interconnected nature, they are distinct methodologies that serve unique purposes when training foundation LLMs to achieve different objectives. In this blog, we will explore the differences between transfer Learning and full fine-tuning, learning about their characteristics and how they come into play in real-world scenarios related to natural language understanding (NLU) and natural language generation (NLG) tasks with the help of examples. We will also learn …
AI-assisted Software Development: Tools & Processes

In the rapidly evolving landscape of software development, the integration of artificial intelligence (AI) and generative AI (Gen AI) is not just a luxury but a cornerstone for enhancing software development velocity. This blog delves into the key aspects of Gen AI and AI-assisted software development, presenting actionable takeaways for software leaders, including engineering managers, project managers, product managers, and software engineers. We will look into different tools and related processes that can be enhanced across the entire software development lifecycle. Design & Architect: Crafting the Blueprint Integrate the following tools to speed up the design process while ensuring adherence to best practices, significantly reducing design iteration times. Code & …
Generalization Errors in Machine Learning: Python Examples
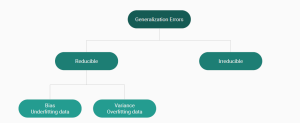
Last updated: 21st Jan, 2024 Machine Learning (ML) models are designed to make predictions or decisions based on data. However, a common challenge, data scientists face when developing these models is ensuring that they generalize well to new, unseen data. Generalization refers to a model’s ability to perform accurately on new, unseen examples after being trained on a limited set of data. When models don’t generalize well, they commit errors. These errors are called generalization errors. In this blog, you will learn about different types of generalization errors, with examples, and walk through a simple Python demonstration to illustrate these concepts. Types of Generalization Errors Generalization errors in machine learning …
Transformer Architecture in Deep Learning: Examples
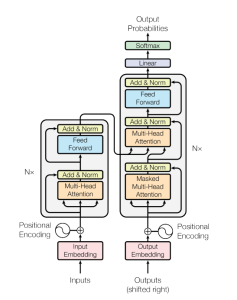
The Transformer model architecture, introduced by Vaswani et al. in 2017, is a deep learning model that has revolutionized the field of natural language processing (NLP) giving rise to large language models (LLMs) such as BERT, GPT, T5, etc. In this blog, we will learn about the details of transformer model architecture with the help of examples and references from the mother paper – Attention is All You Need. Transformer Block – Core Building Block of Transformer Model Architecture Before getting to understand the details of transformer model architecture, let’s understand the key building block termed transformer block. The core building block of the Transformer architecture consists of multi-head attention …
LLM Training & GPU Memory Requirements: Examples
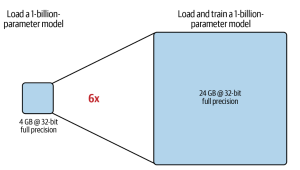
As data scientists and MLOps Engineers, you must have come across the challenges related to managing GPU requirements for training and deploying large language models (LLMs). In this blog, we will delve deep into the intricacies of GPU memory demands when dealing with LLMs. We’ll learn with the help of various examples to better understand how GPU memory impacts the performance and feasibility of training these LLMs. Whether you’re planning to train a foundation (pre-trained) model or fine-tuning an existing model, the insights are aimed to guide you through the crucial considerations of GPU memory allocation. Greater details can be found in this book: Generative AI on AWS. Understanding GPU …
Instruction Fine-tuning LLM Explained with Examples
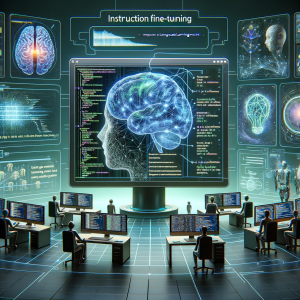
A pre-trained or foundation model is further trained (or fine-tuned) with instructions datasets to help them learn about your specific data and perform humanlike tasks. These models are called instruction fine-tuning LLMs. In this blog, we will learn about the concepts and different examples of instruction fine-tuning models. You might want to check out this book to learn more: Generative AI on AWS. What are Instruction fine-tuning LLMs? Instruction fine-tuning LLMs, also called chat or instruct models, are created by training pre-trained models with different types of instructions. Instruction fine-tuning can be defined as a type of supervised machine learning that improves the foundation model by continuously comparing the model’s …
Distributed LLM Training & DDP, FSDP Patterns: Examples
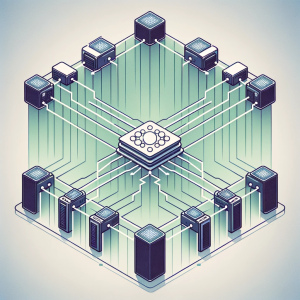
Training large language models (LLMs) like GPT-4 requires the use of distributed computing patterns as there is a need to work with vast amounts of data while training with LLMs having multi-billion parameters vis-a-vis limited GPU support (NVIDIA A100 with 80 GB currently) for LLM training. In this blog, we will delve deep into some of the most important distributed LLM training patterns such as distributed data parallel (DDP) and Fully sharded data parallel (FSDP). The primary difference between these patterns is based on how the model is split or sharded across GPUs in the system. You might want to check out greater details in this book: Generative AI on …
Transformer Architecture Types: Explained with Examples
Are you fascinated by the power of deep learning large language models that can generate creative writing, answer complex questions, etc? Ever wondered how these LLMs understand and process human language with such finesse? At the heart of these remarkable achievements lies a machine learning model architecture that has revolutionized the field of Natural Language Processing (NLP) – the Transformer architecture and its types. But what makes Transformer models so special? From encoding sentences into numerical embeddings to employing attention mechanisms that capture the relationships between words, we will dissect different types of Transformer architectures, provide real-world examples, and even dive into the mathematics that governs its operation. Let’s explore …
Blueprint: Deploying Generative AI Applications
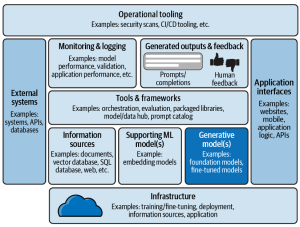
In this blog, we will learn about a comprehensive framework for the deployment of generative AI applications, breaking down the essential components that architects must consider. Learn more about this topic from this book: Generative AI on AWS. The following is a solution / technology architecture that represents a blueprint for deploying generative AI applications. The following is an explanation of the different components of this architectural viewpoint:
Pre-trained Models Explained with Examples
NLP has been around for decades, but it has recently seen an explosion in popularity due to pre-trained models (PTMs), also termed foundation models. This blog post will introduce you to different types of pre-trained (a.k.a. foundation) machine learning models and discuss their usage in real-world examples. Before we get into looking at different types of pre-trained models in NLP, let’s understand the concepts related to pre-trained models. What are Pre-trained Models? Pre-trained models (PTMs) are very large and complex neural network-based deep learning models, such as transformers, that consist of billions of parameters (a.k.a. weights) and have been trained on very large datasets to perform specific NLP tasks. The …
BERT vs GPT Models: Differences, Examples
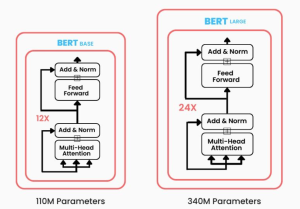
Have you been wondering what sets apart two of the most prominent transformer-based machine learning models in the field of NLP, Bidirectional Encoder Representations from Transformers (BERT) and Generative Pre-trained Transformers (GPT)? While BERT leverages encoder-only transformer architecture, GPT models are based on decoder-only transformer architecture. In this blog, we will delve into the core architecture, training objectives, real-world applications, examples, and more. By exploring these aspects, we’ll learn about the unique strengths and use cases of both BERT and GPT models, providing you with insights that can guide your next LLM-based NLP project or research endeavor. Differences between BERT vs GPT Models BERT, introduced in 2018, marked a significant …
NLP Corpus Types (Text & Multimodal): Examples
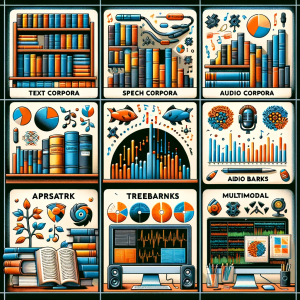
At the heart of NLP lies a fundamental element: the corpus. A corpus, in NLP, is not just a collection of text documents or utterances; it’s at the core of large language models (LLMs) training. Each corpus type serves a unique purpose in terms of training language models that serve different purposes. Whether it’s a collection of written texts, transcriptions of spoken words, or an amalgamation of various media forms, each corpus type holds the key to leveraging different aspects of language to generate value. In this blog, we’re going to explore the significance of these different corpora types in NLP. From the traditional text corpora consisting of written content …
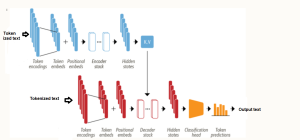
Demystifying Encoder Decoder Architecture & Neural Network
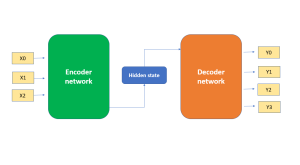
In the field of AI / machine learning, the encoder-decoder architecture is a widely-used framework for developing neural networks that can perform natural language processing (NLP) tasks such as language translation, text summarization, and question-answering systems, etc which require sequence-to-sequence modeling. This architecture involves a two-stage process where the input data is first encoded (using what is called an encoder) into a fixed-length numerical representation, which is then decoded (using a decoder) to produce an output that matches the desired format. In this blog, we will explore the inner workings of the encoder-decoder architecture, how it can be used to solve real-world problems, and some of the latest developments in …
Attention Mechanism Workflow & Transformer: Examples
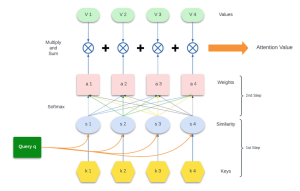
The attention mechanism workflow in the context of transformers in NLP, is a process that enables the model to dynamically focus on certain parts of the input data when performing a task such as machine translation, language understanding, text summarization, etc. Large language models, such as those based on the transformer architecture, rely on attention mechanisms to understand the context of words in a sentence and perform tasks as mentioned earlier. This mechanism selectively weights the significance of different parts of the input. This mechanism is essential for handling sequential data where the importance of each element may vary depending on the context. In this blog, we will learn about …
ChatGPT Prompts Best Practices: Examples
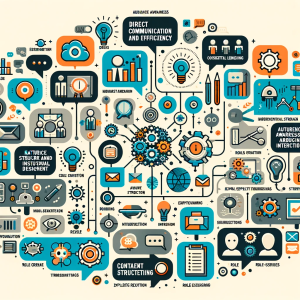
In this blog, you will learn the best practices you can adopt when writing prompts for ChatGPT. Here is the list: Direct Communication and Efficiency Audience Awareness and Contextual Understanding Interactive and Engaging Prompting Prompt Structure and Instructional Design Natural and Unbiased Interaction Content Creation and Revision Role-Assigning and Scripting Explicit Requirements and Mimicry
I found it very helpful. However the differences are not too understandable for me