Handling Class Imbalance in Machine Learning: Python Example
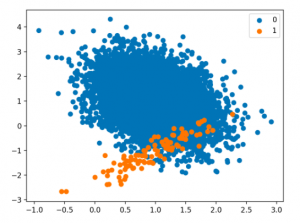
Techniques for Handling Class Imbalance Class imbalance may not always impact performance, and using imbalance-specific methods can sometimes worsen results. Xu-Ying Liu, Jianxin Wu, and Zhi-Hua Zhou, Exploratory Undersampling for Class-Imbalance Learning Above said, there are different techniques such as the following for handling class imbalance when training machine learning models with datasets having imbalanced classes. Python packages such as Imbalanced Learn can be used to apply techniques related to under-sampling majority classes, upsampling minority classes, and SMOTE. In this post, techniques related to using class weight will be used for tackling class imbalance. How to create a Sample Dataset having Class Imbalance? In this section, you will learn about how to create an …
Handling Class Imbalance using Sklearn Resample

Last updated: 5th Dec, 2023 The class imbalance problem in machine learning occurs when the classes in a dataset are not represented equally, leading to a significant difference in the number of instances for different classes. This imbalance can cause a classification model to be biased towards the majority class, resulting in poor performance on the minority class. Thus, the class imbalance hinders data scientists by challenging the development of accurate and fair models, as the skewed distribution can lead to misleading training predictions / outcomes and reduced effectiveness in real-world applications where minority classes are critical. In this post, you will learn about how to tackle class imbalance issue …
Ordinary Least Squares Method: Concepts & Examples
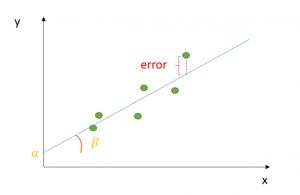
Last updated: 5th Dec, 2023 Regression analysis is a fundamental statistical technique used in many fields, from finance, econometrics to social sciences. It involves creating a regression model for modeling the relationship between a dependent variable and one or more independent variables. The Ordinary Least Squares (OLS) method helps estimate the parameters of this regression model. Ordinary least squares (OLS) is a technique used in linear regression model to find the best-fitting line for a set of data points by minimizing the residuals (the differences between the observed and predicted values). It does so by estimating the coefficients of the linear regression model by minimizing the sum of the squared …
Linear Regression vs Correlation: Examples
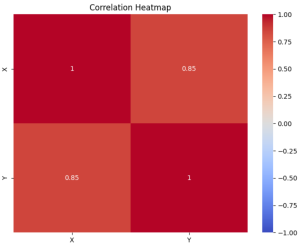
Linear regression and correlation are fundamental concepts in statistics, often used in data analysis to understand the relationship between two variables. Linear regression and correlation, while related, are not the same. They serve different purposes and provide different types of information. In this blog, we will explore each concept with examples to clarify their differences and applications. Linear Regression vs Correlation: Definition Linear Regression is a statistical method used for modeling the relationship between a dependent variable and one or more independent variables. The core idea is to find a linear equation that best describes this relationship, enabling the prediction of the dependent variable based on the values of the …
Different Types of CNN Architectures Explained: Examples

Last updated: 4th Dec, 2023. In the fast-paced world of computer vision and image processing, the problem of image classification consistently stands out: the ability to effectively recognize and classify images. As we continue to digitize and automate our world, the demand for systems that can understand and interpret visual data is growing at an unprecedented rate. The challenge is not just about recognizing images – it’s about doing so accurately and efficiently. Traditional machine learning methods often fall short, struggling to handle the complexity and high dimensionality of image data. This is where Convolutional Neural Networks (CNNs) comes to rescue. And, there are different types of CNN architectures based …
MongoDB – Commands to Check the Status of MongoDB Database
This article represents different commands which can be used to check the status of MongoDB database on Linux/Ubuntu. Please feel free to comment/suggest if I missed to mention one or more important points. Also, sorry for the typos. MongoDB Status Check Commands The following represents some of the commands that can be used to check the status of MongoDB database. Note that mongod represents the daemon process of MongDB databass and, primarily, used to manage database access. It is recommended to check the log file (/var/log/mongo/mongo.log) to get details. Following are some of the commands which can be used to get the status of Mongodb: service mongod status: Displays the status …
Logit vs Probit Models: Differences, Examples
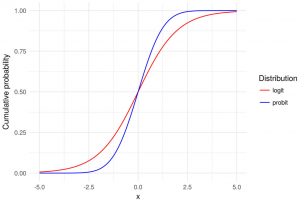
Logit and Probit models are both types of regression models commonly used in statistical analysis, particularly in the field of binary classification. This means that the outcome of interest can only take on two possible values / classes. In most cases, these models are used to predict whether or not something will happen in form of binary outcome. For example, a bank might want to know if a particular borrower might default on loan or otherwise. In this blog post, we will explain what logit and probit models are, and we will provide examples of how they can be used. As data scientists, it is important to understand the concepts …
Linear Regression Cost Function: Python Example

Linear regression is a foundational algorithm in machine learning and statistics, used for predicting numerical values based on input data. Understanding the cost function in linear regression is crucial for grasping how these models are trained and optimized. In this blog, we will understand different aspects of cost function used in linear regression including how it does help in building a regression model having high performance. What is a Cost Function in Linear Regression? In linear regression, the cost function quantifies the error between predicted values and actual data points. It is a measure of how far off a linear model’s predictions are from the actual values. The most commonly …
KNN vs Logistic Regression: Differences, Examples
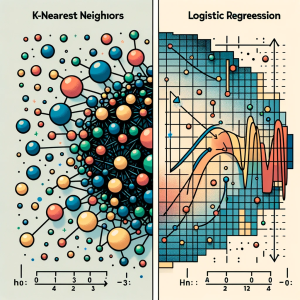
In this blog, we will learn about the differences between K-Nearest Neighbors (KNN) and Logistic Regression, two pivotal algorithms in machine learning, with the help of examples. The goal is to understand the intricacies of KNN’s instance-based learning and Logistic Regression‘s probability modeling for binary and multinomial outcomes, offering clarity on their core principles. We will also navigate through the practical applications of K-NN and logistic regression algorithms, showcasing real-world examples in various business domains like healthcare and finance. Accompanying this, we’ll provide concise Python code samples, guiding you through implementing these algorithms with datasets. This dual focus on theory and practicality aims to equip you with both the understanding …
6 Types of Brainstorming Techniques for Ideas Generation
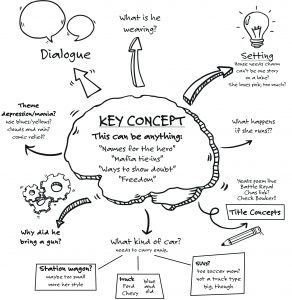
Last updated: 1st Dec, 2023 Generating innovative and creative ideas is a key component of success in many fields, from business and marketing to science, technology, and the arts. However, the process of coming up with new and unique ideas can be challenging, especially when faced with deadlines, limited resources, or creative blocks. This is where brainstorming or mindstorming comes into picture. Fortunately, there are several different types of brainstorming techniques that can help individuals and teams generate great ideas and innovate. While brainstorming is one of the most effective techniques out there, not all brainstorming sessions are created equal. The question that is frequently asked is how to brainstorm for effective …
Python – How to Create Scatter Plot with IRIS Dataset

Last updated: 1st Dec, 2023 In this blog post, we will be learning how to create a Scatter Plot with the IRIS dataset using Python. The IRIS dataset is a collection of data that is used to demonstrate the properties of various statistical models. It contains information about 50 observations on four different variables: Petal Length, Petal Width, Sepal Length, and Sepal Width. As data scientists, it is important for us to be able to visualize the data that we are working with. Scatter plots are a great way to do this because they show the relationship between two variables. In this post, we learn how to plot IRIS dataset …
Chebyshev’s Theorem: Formula & Examples
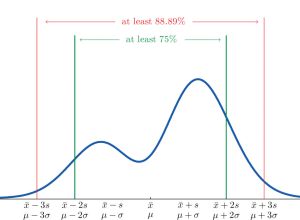
Chebyshev’s theorem is a fundamental concept in statistics that allows us to determine the probability of data values falling within a certain range defined by mean and standard deviation. This theorem makes it possible to calculate the probability of a given dataset being within K standard deviations away from the mean. It is important for data scientists, statisticians, and analysts to understand this theorem as it can be used to assess the spread of data points around a mean value. What is Chebyshev’s Theorem? Chebyshev’s Theorem, also known as Chebyshev’s Rule, states that in any probability distribution, the proportion of outcomes that lie within k standard deviations from the mean …
AIC in Logistic Regression: Formula, Example

Have you as a data scientist ever been challenged by choosing the best logistic regression model for your data? As we all know, the difference between a good and the best model while training machine learning model can be subtle yet impactful. Whether it’s predicting the likelihood of an event occurring or classifying data into distinct categories, logistic regression provides a robust framework for analysts and researchers. However, the true power of logistic regression is harnessed not just by building models, but also by selecting the right model. This is where the Akaike Information Criterion (AIC) comes into play. In this blog, we’ll delve into different aspects of AIC, decode …
Types of SQL Joins: Differences, SQL Code Examples

Structured Query Language (SQL) is one of the most important and widely used tools for data manipulation. It allows users to interact with databases, query and manipulate data, and create reports. One of SQL’s most important features is its ability to join tables together in order to enrich, compare and analyze related data. These joins are termed as inner join, outer join, left join and right join. In this article, we will discuss the different types of joins available in SQL, their differences and provide examples of how each can be used. What is SQL Join? SQL Joins are a technique used in Structured Query Language (SQL) to combine two …
30+ Logistic Regression Interview Questions & Answers

Last updated: 29th Nov, 2023 This page lists down the practice tests / interview questions and answers for Logistic regression in machine learning. Those wanting to test their machine learning knowledge in relation with logistic regression would find these practice tests very useful. The goal for these practice tests is to help you check your knowledge in logistic regression machine learning models from time-to-time. More importantly, when you are preparing for interviews, these practice tests are intended to be handy enough. Those going for freshers / intern interviews in the area of machine learning would also find these practice tests / interview questions to be very helpful. These test primarily focus on …
Standard Deviation vs Standard Error: Formula, Examples
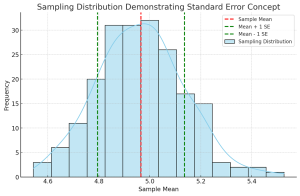
Understanding the differences between standard deviation and standard error is crucial for anyone involved in statistical analysis or research. These concepts, while related, serve different purposes in the realm of statistics. In this blog, we will delve into their differences, applications in research, formulas, and practical examples. Introduction to Standard Deviation & Standard Error At the heart of statistical analysis lies the need to understand and quantify variability. This is where standard deviation and standard error come into play. What’s standard deviation? Standard Deviation is a measure that reflects the amount of variation or dispersion within a dataset. It indicates how much individual data points deviate from the mean (average) …

I found it very helpful. However the differences are not too understandable for me