Category Archives: statistics
Two sample Z-test for Proportions: Formula & Examples
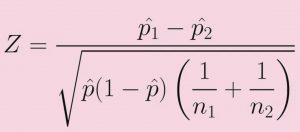
In statistics, a two-sample z-test for proportions is a method used to determine whether two samples are drawn from the same population. This test is used when the population proportion is unknown and there is not enough information to use the chi-squared distribution. The test uses the standard normal distribution to calculate the test statistic. As data scientists, it is important to know how to conduct this test in order to determine whether two proportions are equal. In this blog post, we will discuss the formula and examples of the two-proportion Z-test. What is two proportion Z-test? A two-proportion Z-test is a statistical hypothesis test used to determine whether two …
Linear regression hypothesis testing: Concepts, Examples
In relation to machine learning, linear regression is defined as a predictive modeling technique that allows us to build a model which can help predict continuous response variables as a function of a linear combination of explanatory or predictor variables. While training linear regression models, we need to rely on hypothesis testing in relation to determining the relationship between the response and predictor variables. In the case of the linear regression model, two types of hypothesis testing are done. They are T-tests and F-tests. In other words, there are two types of statistics that are used to assess whether linear regression models exist representing response and predictor variables. They are …
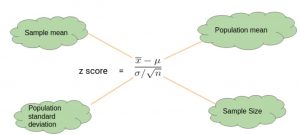
One-sample Z-test for Means: Formula & Examples
One sample Z-test for means is one of the statistical techniques used for testing hypothesis related to whether the sample belongs to a population. As a data scientist, you must get a good understanding of the z-test and its applications to test the hypothesis for your statistical models. In this blog post, we will discuss the one sample z-test for means and its concepts with an example. You may want to check my post on hypothesis testing titled – Hypothesis testing explained with examples What is One-sample Z-test for Means? Z-test is usually referred to as a 1-sample Z-test for means that is used to test the hypothesis about the …
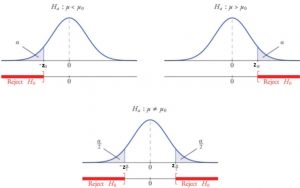
Z-tests for Hypothesis testing: Formula & Examples
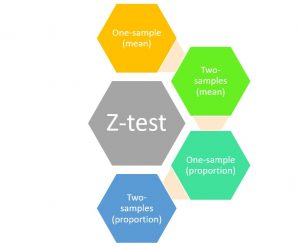
Z-tests are statistical hypothesis testing techniques that are used to determine whether the null hypothesis relating to comparing sample means or proportions with that of population at a given significance level can be rejected or otherwise based on the z-statistics or z-score. As a data scientist, you must get a good understanding of the z-tests and its applications to test the hypothesis for your statistical models. In this blog post, we will discuss an overview of different types of z-tests and related concepts with the help of examples. You may want to check my post on hypothesis testing titled – Hypothesis testing explained with examples What are Z-tests & Z-statistics? …
One sample Z-test for proportion: Formula & Examples
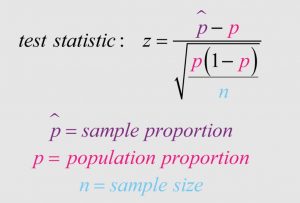
One proportion z-test or one-sample Z-test for proportion is one of the most popular statistical hypothesis tests dealing with one sample proportion. It is used to determine whether or not a hypothesized mean difference between the sample and the population can be rejected by drawing conclusions from sample data. As a data scientist, it is important to be proficient in this type of Z-test and understand how it works. In this blog post, we will learn about how one proportion z-test works with the help of formula and examples. What is one sample Z-test for proportion? A one proportion Z-test is a hypothesis testing technique which is used for testing …
Z-test MCQs with Answers: Interview Questions
In this blog post, you can test your knowledge about Z-test, Z-statistics and related concepts through multiple choice questions (MCQs) and answers. Getting a good understanding of Z-tests, Z-statistics and Z-distribution is of utmost importance for data scientists at large. The following are key concepts around which the MCQs are posted: Z-score or Z-statistics concepts Estimation of population mean and proportion 1-sample Z-test for mean and proportion 2-samples Z-test for mean and proportion Z-test Interview Questions Samples The following is a list of interview questions that you would want to learn: What is Z-score? Explain with an example and formula. What are different types of Z-tests? Explain with formula and …
Z-Score Explained with Ronaldo / Robert Example

In this post, you will learn the concepts of Z-Score with the help from examples including Christiano Ronaldo and Robert Lewandowski. You will learn about how to compare and call out whose performance was better in Champions League 2019-2020. As a data scientist, it will be extremely important to learn the concepts of Z-Scores, also called as Standard scores, as it would help you evaluate / compare a particular data set with past data set. Before getting into the example of Z-scores, lets understand some concepts of Z-scores. What’s Z-Score or Z-statistics? Z-score can be defined as number of standard deviations the data point is above or below the mean …
Normal Distributions Questions and Answers for Interviews
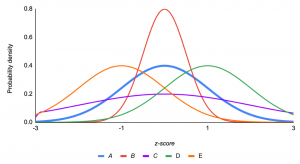
In order to be successful in normal distribution interviews, you need a solid understanding of the normal distribution. This blog post will focus on normal distribution questions and answers that are commonly asked in the data science and statistics interviews. Before jumping into questions and answers, lets quickly understand what normal distribution is. What is normal distribution? A normal distribution is a symmetric, bell-shaped curve that describes the distribution of many types of data. The normal distribution has two parameters, mean and standard deviation. It is important to know these two parameters because they are used to calculate probabilities associated with the normal distribution. The normal curve describes how data …
Level of Significance & Hypothesis Testing
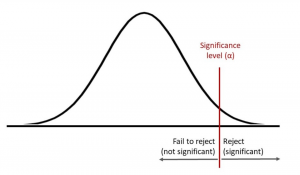
In hypothesis testing, the level of significance is a measure of how confident you can be about rejecting the null hypothesis. This blog post will explore what hypothesis testing is and why understanding significance levels are important for your data science projects. In addition, you will also get to test your knowledge of level of significance towards the end of the blog with the help of quiz. These questions can help you test your understanding and prepare for data science / statistics interviews. Before we look into what level of significance is, let’s quickly understand what is hypothesis testing. What is Hypothesis testing and how is it related to significance …
P-Value & Hypothesis Testing: Examples
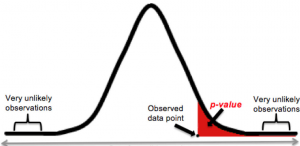
Many describe p-value as the probability that the null hypothesis holds good. That is an incorrect definition. The concept of p-value is understood differently by different people and is considered as one of the most used & abused concepts in statistics, mostly in relation to hypothesis testing. In this blog post, you will learn the P-VALUE concepts with multiple different examples. It is extremely important to get a good understanding of P-value if you are starting to learn data science/machine learning as the concepts of P-value are key to hypothesis testing. Before getting into the description of p-value, let’s quickly go through the hypothesis testing concepts to get a good …
Type I & Type II Errors in Hypothesis Testing: Examples

This article describes Type I and Type II errors made due to incorrect evaluation of the outcome of hypothesis testing, based on a couple of examples such as the person comitting a crime, the house on fire, and Covid-19. You may want to note that it is key to understand type I and type II errors as these concepts will show up when we are evaluating a hypothesis such as those related to machine learning algorithms (linear regression, logistic regression, etc). For example, in the case of linear regression models, the significance value is compared with the p-value and, the null hypothesis that the parameter/coefficient is equal to zero is …
Survival Analysis Modeling for Customer Churn
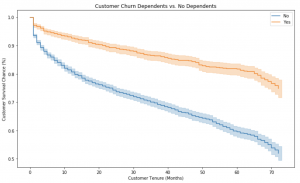
Customer churn is a prevalent problem for many businesses. It can happen in several different ways, such as when customers stop using the product, or when they leave because of an issue with customer service. This blog post will explore survival analysis modeling and what it can do to help you better understand customer churn problems. First, we will discuss survival analysis itself and why it is beneficial for analyzing customer behavior. Then we will show some examples on how survival analysis has been used to analyze customer churn problems. As data scientists, it will be good to familiarize ourselves with survival analysis, as it is a popular modeling technique …
Poisson Distribution Explained with Python Examples

Poisson distribution is a probability distribution that can be used to model the number of events in a fixed interval. It is often referred to as “random poisson process” or “poisson process”. The poisson distribution describes how many occurrences of an event occur within a given time frame, for example, how many customers visit your store or restaurant every hour. In this post, you will learn about the concepts of Poisson probability distribution with Python examples. As a data scientist, you must get a good understanding of the concepts of probability distributions including normal, binomial, Poisson etc. What is Poisson distribution? Poisson distribution is the discrete probability distribution which represents the …
Negative Binomial Distribution Python Examples
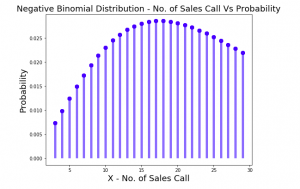
In this post, you will learn about the concepts of negative binomial distribution explained using real-world examples and Python code. We will go over some of the following topics to understand negative binomial distribution: What is negative binomial distribution? What is difference between binomial and negative binomial distribution? Negative binomial distribution real-world examples Negative binomial distribution Python example What is Negative Binomial Distribution? Negative binomial distribution is a discrete probability distribution representing the probability of random variable, X, which is number of Bernoulli trials required to have r number of successes. This random variable is called as negative binomial random variable. And, the experiment representing X number of Bernoulli trials required to product r successes is called …
Geometric Distribution Explained with Python Examples

In this post, you will learn about the concepts of Geometric probability distribution with the help of real-world examples and Python code examples. It is of utmost importance for data scientists to understand and get an intuition of different kinds of probability distribution including geometric distribution. You may want to check out some of my following posts on other probability distribution. Normal distribution explained with Python examples Binomial distribution explained with 10+ examples Hypergeometric distribution explained with 10+ examples In this post, the following topics have been covered: Geometric probability distribution concepts Geometric distribution python examples Geometric distribution real-world examples Geometric Probability Distribution Concepts Geometric probability distribution is a discrete …
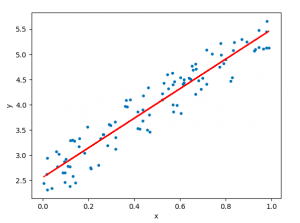
Python – How to Add Trend Line to Line Chart / Graph

In this plot, you will learn about how to add trend line to the line chart / line graph using Python Matplotlib.As a data scientist, it proves to be helpful to learn the concepts and related Python code which can be used to draw or add the trend line to the line charts as it helps understand the trend and make decisions. In this post, we will consider an example of IPL average batting scores of Virat Kohli, Chris Gayle, MS Dhoni and Rohit Sharma of last 10 years, and, assess the trend related to their overall performance using trend lines. Let’s say that main reason why we want to …
I found it very helpful. However the differences are not too understandable for me