One proportion z-test or one-sample Z-test for proportion is one of the most popular statistical hypothesis tests dealing with one sample proportion. It is used to determine whether or not a hypothesized mean difference between the sample and the population can be rejected by drawing conclusions from sample data. As a data scientist, it is important to be proficient in this type of Z-test and understand how it works. In this blog post, we will learn about how one proportion z-test works with the help of formula and examples.
What is one sample Z-test for proportion?
A one proportion Z-test is a hypothesis testing technique which is used for testing hypothesis about a hypothesized proportion in comparison to a given theoretical proportion of the population. The test is used to determine if the difference between the sample proportion (hypothesized) and population theoritical proportion is significant or not. One-proportion z-test can be used for one-tailed or two-tailed test. The p-value for one sample z-test for proportion is calculated using the Z statistic. When conducting one proportion z-test, if the p-value is less than the significance level, we can reject the null hypothesis. Otherwise, we fail to reject it. A one proportion z-test can be used to answer the following questions:
- Is there a difference between the sample proportion (hypothesized) and population proportion (theoritical)? In other words, the sample bellongs to the current population in terms of hypothesis around no difference in proportions.
- What is the magnitude of the difference between the sample proportion and population proportion?
- Is this difference statistically significant? Accordingly, can the null hypothesis be rejected or otherwise?
In order to conduct this type of test, we need to know the following:
- The hypothesized value for the population proportion (p); In other words, the sample proportion (p)
- The value of theoretical proportion
- The standard error
- The sample size (n)
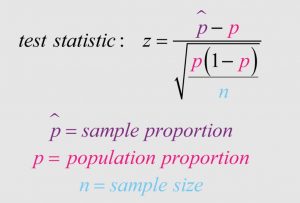
The formula of Z-statistics or Z-score for 1-proportion Z-test is:
Z = (p – P0) / SE
Where,
P0 = Population proportion (theoritical)
p = Sample proportion (hypothesized)
SE = Standard error
The value of standard error for 1-sample proportion Z-test can be calculated using the following formula. The standard error can also be termed as the standard deviation of the sample proportion from the population proportion.
SE = SQRT[P0(1-P0)/n]
Where,
P0 = Population proportion
n = Sample size
Examples of one proportion Z-test
Let’s take an example to understand how one proportion z-test works. Suppose we want to test whether there is a difference between the population and sample proportions for unemployment rate in a particular city. The claim is made that in a particular city, the unemployment rate is not same as the theoretical or well-established population proportion. The ask is to test the claim or hypothesis and find out whether the difference is statistically significant and can’t be attributed to the chance occurrence. Let’s say the population proportion for unemployment rate is 10%. A sample of 50 persons is taken and the unemployment rate was found to be 14% (7 persons out of 50 were found to be unemployed). Is the difference statistically significant at the level of significance of 0.05.
P0 = The value of theoretical proportion is 0.1 (10%)
p = The sample proportion is 0.14 (14%)
n = The sample size is 50
Now, we will calculate the Z-statistics or Z-score with the help of the following formula.
Z = (p – P0) / SE
SE = SQRT[P0(1-P0)/n]
The value of Z-score comes out to be 0.95. The p-value comes out to be 0.34211 for two-tailed test. At a significance level of 0.05, the test result is not statistically significant and thus, we can’t reject the null hypothesis based on the given evidence (sample selected). This indicates that the test outcome has happened purely by chance.
In real-world, one proportion z-test is used to compare the hypothesized proportion with that of theoritical population proportion. For example, one proportion z-test can be used to test whether there is a difference between the proportions of unemployment rate of a particular city against the theoritical population proportion of the whole country. Another example could be testing the difference between proportions of smokers in a city or region vs the theoritical population proportion. Yet another example can be testing the difference between proportions of people who voted for a particular party in a particular region vs the theoritical population proportion.
Summary
One proportion z-test is a statistical test used to determine if there is a difference between the population theoritical and sample hypothesized proportions. The test can be used to answer questions such as: “Is there a difference between the population and sample proportions?” In order to conduct one proportion z-test, we need to know the information such as the hypothesized value for the population proportion, the value of theoretical proportion and the standard error that can be calculated as a function of value of theoretical proportion and the sample size. In real-world, one proportion z-test can be used in different scenarios such as medical studies, surveys or product testing. If you would like to learn more, please drop a message with your queries or suggestions.

Check out my latest book titled as First Principles Thinking: Building winning products using first principles thinking.
- Mathematics Topics for Machine Learning Beginners - July 6, 2025
- Questions to Ask When Thinking Like a Product Leader - July 3, 2025
- Three Approaches to Creating AI Agents: Code Examples - June 27, 2025
I found it very helpful. However the differences are not too understandable for me