
Many describe p-value as the probability that the null hypothesis holds good. That is an incorrect definition. The concept of p-value is understood differently by different people and is considered as one of the most used & abused concepts in statistics, mostly in relation to hypothesis testing. In this blog post, you will learn the P-VALUE concepts with multiple different examples. It is extremely important to get a good understanding of P-value if you are starting to learn data science/machine learning as the concepts of P-value are key to hypothesis testing.
Before getting into the description of p-value, let’s quickly go through the hypothesis testing concepts to get a good understanding.
What is Hypothesis Testing?
Hypothesis testing can be defined as the statistical framework which can be used to test whether the claim made about anything is true or otherwise. Take a look at the examples of the following claim. This will require hypothesis testing.
- Students of class X studying for more than 6 hours a day on average secures more than 75% marks.
- Anyone walking more than 4 km for 30 consecutive days will lose more than 2 kg weight.
Hypothesis testing requires the formulation of the null hypothesis and the alternate hypothesis. The null hypothesis represents the default state of belief in the real world. For example, the coin is fair. Or, the dice is fair. The alternate hypothesis represents something different and unexpected. The following represent key steps in hypothesis testing. Note the usage of p-value:
- Formulate the null and alternative hypotheses.
- Define the test statistic (such as z-value, or, t-value) that summarizes the strength of evidence against the null hypothesis.
- Determine the appropriate level of significance (0.1, 0.05, or 0.01)
- Compute the p-value that quantifies the probability of having obtained a comparable or more extreme value of the test statistic given that the null hypothesis is true.
- Based on the p-value and level of significance, decide whether the test outcome is statistically significant and hence reject the null hypothesis or otherwise.
A detailed explanation is provided in one of my related posts titled hypothesis testing explained with examples.
What is P-VALUE?
In hypothesis testing, once the test statistics are determined to evaluate the null hypothesis, the next step is to compute the probability of observing a test statistic as extreme, under the assumption that the null hypothesis Ho is true. This probability is called the P-value. If the value of p-value is smaller than the level of significance, it provides evidence against the null hypothesis. For example, let’s say we are testing the claim that the students studying more than 6 hours on average get more than 75% marks. Here are the steps followed:
- The null hypothesis is that there is no relationship between students for more than 6 hours a day on average and them getting more than 75% marks.
- The data sample for 30 students is gathered.
- Test statistics is t-value and the level of significance is set as 0.05.
- The mean of 30 students is found to be 79% with a standard deviation of 4%
- T-value comes out to be +5.48.
- P-value comes out to be less than 0.00001.
- As the p-value is less than the significance level of 0.05, the test outcome is statistically significant.
- The null hypothesis can thus be rejected. Thus, based on the evidence, the claim can be accepted that students studying more than 6 hours a day on average score more than 75%.
The p-value can be defined as the probability of obtaining test statistics more extreme than the ones observed if we repeated the experiment many many times, provided the null hypothesis holds good.
It is measured using techniques such as determining the test statistics such as Z, T, or chi-square and calculating P-value using the related distribution tables such as z-distribution, t-distribution, or chi-square distribution respectively. The distribution of the test statistic for null hypothesis testing will depend on the details of what type of null hypothesis is being tested, and what type of test statistic is used. In general, most commonly-used test statistics follow a well-known statistical distribution under the null hypothesis — such as a normal distribution, at-distribution, a χ2-distribution, or an F-distribution.
P-VALUE explained with Examples
The examples below do not take into consideration the test statistics and p-value for explaining whether the null hypothesis can be rejected or otherwise. These examples however intend to explain the concepts regarding the p-value and the notion regarding rejecting or failing to reject the null hypothesis.
Let’s take a quick example to understand the concept of P-value. Given the co-ed school consisting of both boys and girls students, let’s test the hypothesis that the boys on average always score a greater percentage of marks than girls in the school. In order to test the hypothesis, as a first step, we will need to formulate the null and alternate hypotheses.
- Null hypothesis: The null hypothesis is the fact that it is not true that boys on average always score a greater percentage of marks than girls.
- Alternate hypothesis: The alternate hypothesis is that the boys on average always score a greater percentage of marks than girls. As part of the test, several random samples of 30 students are taken comprising of both boys.
Out of 10 different samples of 30 students taken comprising of both boys and girls, in 6 samples, the boys on average were found to score a greater percentage of marks than girls. Do we have enough evidence to reject the null hypothesis? It does not look like that. In case, out of 10 samples, in 9 samples, the boys would have been found to score the greater marks than girls, this would not have been a likely result given the null hypothesis is true. Thus, we would have rejected the null hypothesis in favor of the alternate hypothesis – the claim we made in the beginning. However, given that only 6 samples are found where the boys on average scored greater marks than girls, we do have some evidence but not enough to reject the null hypothesis. In this scenario, we will fail to reject the null hypothesis.
The P-VALUE is used to represent whether the outcome of a hypothesis test is statistically significant enough to be able to reject the null hypothesis. It lies between 0 and 1.
The threshold value below which the P-VALUE becomes statistically significant is usually set to be 0.05. The threshold value is called the level of significance and is a function of confidence level. One could choose to set different threshold values (such as 0.025 or 0.01) based on the confidence level based on which one could choose to reject the null hypothesis. A detailed explanation on significance level is provided in one of my related posts titled Level of significance and hypothesis testing.
The following diagram represents the p-value of the test statistics as the area of the shaded region (with red).
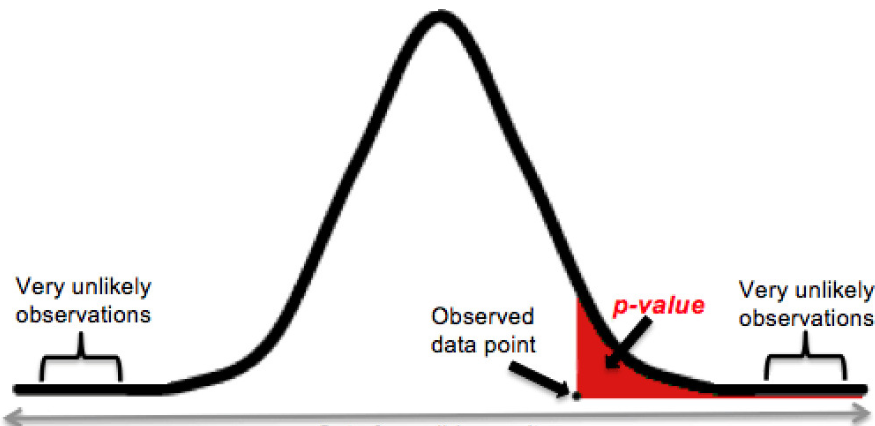
Figure 1. P-Value
P-Value Explained using Null Hypothesis: The Coin is Fair
In case a coin is fair, it is expected that the probability of heads and tails being rolled out is around (or near to) 50%. In order to prove the claim for the population, multiple different experiments with samples representing 10 tosses of coins are done. The null hypothesis is that the coin is fair. The alternate hypothesis is that the coin is unfair. The following represents the test outcomes and interpretation related to when the hypothesis can be rejected.
| Sample (No. of tosses) |
Outcome (No. of Heads) |
Interpretation |
| 10 | 6 | Given that the null hypothesis holds, the test outcome looks to have happened by chance. The outcome is near to the expectation (5/10); Can’t reject the null hypothesis |
| 10 | 7 | Given that the null hypothesis holds, the test outcome looks to be doubtful; Does not look like the outcome happened by chance; However, the evidence is not enough to reject the null hypothesis. |
| 10 | 9 | Given that the null hypothesis holds, with a very high confidence level, it could be stated that the test outcome does not look to have happened by chance; Given that the sample is chosen in a fair and random manner, the null hypothesis, that the coin is fair, can be rejected. The alternate hypothesis is accepted which implies that the coin is not fair. |
| 10 | 4 | Given that the null hypothesis holds, there is a high likelihood that the test outcome looks to have happened by chance; Can’t reject the null hypothesis |
| 10 | 1 | Given that the null hypothesis holds, with a very high confidence level, it could be stated that the test outcome definitely does not look to have happened by chance; Given that the sample is chosen in a fair and random manner, the null hypothesis, that the coin is fair, can be rejected. The alternate hypothesis is accepted which implies that the coin is not fair. |
In the above example, the tests with a number of heads counted as 9 and 1 (red) in a random sample of 10 tosses are at an extreme level. The test outcomes look to be significant enough to indicate that the test results do not look to have happened by chance and that it is incorrect to claim that the coin is fair. In such cases, the P-Value may/will turn out to be lesser than 0.05. Given that the level of significance is set to be 0.05, the P-value can be used to indicate that the null hypothesis can be rejected. Thus, one could reject the null hypothesis.
P-Value Explained using Null Hypothesis: The Dice is Fair
In case the dice is fair, it is expected that the probability of getting 6 when the dice is rolled out is around (or near to) 16.67% (Expected value – the probability of 1/6). In order to prove the claim for the population, multiple different experiments with samples representing 50 tosses of dice are done. The null hypothesis is that the dice are fair. The alternate hypothesis is that the dice are unfair. The following represents the test outcomes and interpretation related to when the hypothesis can be rejected.
| Sample (No. of tosses) |
Outcome (No. of 6s) |
Interpretation |
| 50 | 25 | Given that the null hypothesis holds, the test outcome looks to be doubtful; Does not look like the outcome happened by chance; However, the evidence is not enough to reject the null hypothesis. |
| 50 | 15 | Given that the null hypothesis holds, there is a high likelihood that the test outcome looks to have happened by chance; Can’t reject the null hypothesis |
| 50 | 3 | With a very high confidence level, it could be stated that the test outcome does not look to have happened by chance; Given that the sample is chosen in a fair and random manner, the null hypothesis, that the dice are fair, can be rejected. The alternate hypothesis is accepted which implies that the dice are not fair. |
| 50 | 38 | The test outcome looks to be doubtful; Does not look like the outcome happened by chance; However, the evidence is not enough to reject the null hypothesis. |
| 50 | 47 | With a very high confidence level, it could be stated that the test outcome definitely does not look to have happened by chance; Given that the sample is chosen in a fair and random manner, the null hypothesis, that the dice are fair, can be rejected. The alternate hypothesis is accepted which implies that the dice are not fair. |
In the above example, the tests with a number of 6s counted as 3 and 48 (red) in a random sample of 50 tosses are at an extreme level. The test outcomes look to be significant enough to indicate that the test results do not look to have happened by chance and that it is incorrect to claim that the dice are fair. In such cases, the P-Value may/will turn out to be lesser than 0.05. Given that the level of significance is set to be 0.05, the P-value can be used to indicate that the null hypothesis can be rejected. Thus, one could reject the null hypothesis.
References
Summary
In this post, you learned about what is P-Value with the help of examples. Understanding P-Value is important for Data Scientists as it is used for hypothesis testing related to whether there is a relationship between a response variable and predictor variables. Hope you liked the details presented in the post. Please leave your comments or feel free to suggest.

Check out my latest book titled as First Principles Thinking: Building winning products using first principles thinking.
- Mathematics Topics for Machine Learning Beginners - July 6, 2025
- Questions to Ask When Thinking Like a Product Leader - July 3, 2025
- Three Approaches to Creating AI Agents: Code Examples - June 27, 2025
I found it very helpful. However the differences are not too understandable for me