Category Archives: statistics
Difference between Probability & Statistics

Are you confused about the difference between probability and statistics? You are not alone! Many struggle to determine the key distinctions between these two closely related topics. In this blog, we will discuss the major differences between probability and statistics with the help of examples, as well as how they are used in the field of data science. By understanding the nuances between probability and statistics, you will be able to use these concepts appropriate when solving data science related problems. So here we go! Probability & Statistics Difference – By Example Take a bag of marbles. You got your hand in the bag blindly and grabbed a handful of …
Geometric Distribution Concepts, Formula, Examples
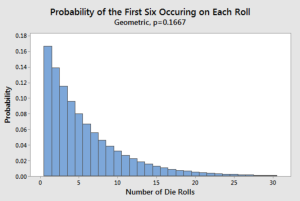
Geometric Distribution, a widely used concept in probability theory, is used to represent the probability of achieving success or failure in a series of independent trials, where the probability of success remains constant. It is one of the essential tools used in a wide range of fields, including economics, engineering, physics, and statistics. As data scientists / statisticians, it is of utmost important to understand its concepts and applications in a clear manner. In this blog, we will introduce you to the basics of Geometric distribution, starting with its definition and properties. We will also explore the geometric distribution formula and how it is used to calculate the probability of …
Two-way ANOVA Test: Concepts, Formula & Examples
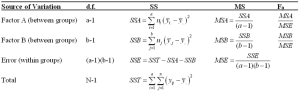
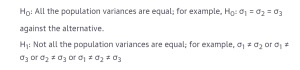
The two-way analysis of variance (ANOVA) test is a powerful tool for analyzing data and uncovering relationships between a dependent variable and two different independent variables. It’s used in fields like psychology, medicine, engineering, business, and other areas that require a deep understanding of how two separate variables interact and impact dependent variable. With the right knowledge, you can use this test to gain valuable insights into your data. Through a two-way ANOVA, data scientists are able to assess complex relationships between multiple variables and draw meaningful conclusions from the data. This helps them make informed decisions and identify patterns in the data that may have gone unnoticed otherwise. Let’s …
Population & Samples in Statistics: Examples
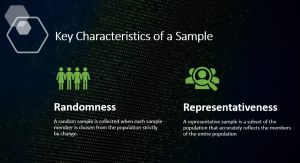
In statistics, population and sample are two fundamental concepts that help us to better understand data. A population is a complete set of objects from which we can obtain data. A population can include all people, animals, plants, or things in a given area. On the other hand, a sample is a subset of the population that is used for observation and analysis. In this blog, we will further explore the concepts of population and samples and provide examples to illustrate the differences between them in statistics. What is a population in statistics? In statistics, population refers to the entire set of objects or individuals about which we want to …
Bayesian thinking & Real-life Examples
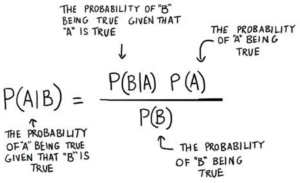
Bayesian thinking is a powerful way of looking at the world, and it can be useful in many real-life situations. Bayesian thinking involves using prior knowledge to make more accurate predictions about future events or outcomes. It is based on the Bayes theorem, which states that the probability of an event occurring is determined by its prior probability combined with new information as it becomes available. It is important for data scientists to learn about Bayesian thinking because it can help them make accurate predictions and draw more meaningful insights from data. In this blog post, we will discuss Bayesian thinking and provide some examples from everyday life to illustrate …
Paired Sample T-Tests: Formula, Examples
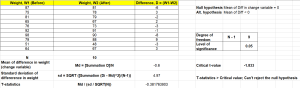
Paired sample t-tests are a commonly used statistical procedure used to compare two populations that are related in some way. They are often used for comparing dependent groups, such as the before and after results of an experiment. Data scientists must have a thorough understanding of the concept of paired sample t-test in order to craft accurate and reliable results when analyzing data. In this blog post, we will explore the formula, assumptions, and examples of paired sample t-tests. What is Paired Sample T-Test and Why is it needed? Paired sample t-tests are used to test whether means of same or similar group different from each other under separate conditions …
Levene Test & Statistics: Concepts & Examples
The Levene test is used to test for equality of variance in a dataset. It is used in statistical analysis to determine if two or more samples have similar variances. If the results of the test indicate that the samples do not have similar variances, then it means that one sample has a higher variance than the other and should be treated as an outlier. In this blog post, we’ll take a look at what exactly the Levene test is, how it works, and provide some examples of how it can be applied. As data scientists, it will be important for us to understand the Levene test in order to …
Categorical Data Visualization: Concepts, Examples
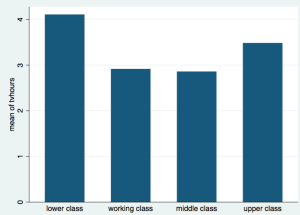
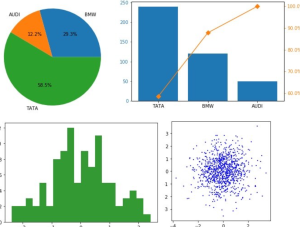
Everyone knows that data visualization is one of the most important tools for any data scientist or statistician. It helps us to better understand the relationships between variables and identify patterns in our data. There are specific types of visualization used to represent categorical data. This type of data visualization can be incredibly helpful when it comes to analyzing our data and making predictions about future trends. In this blog, we will dive into what categorical data visualization is, why it’s useful, and some examples of how it can be used. Types of Data Visualizations for Categorical Dataset When it comes to visualizing categorical data sets, there are primarily four …
Types of Probability Distributions: Codes, Examples
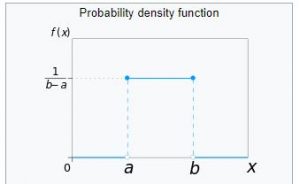
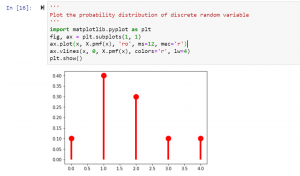
In this post, you will learn the definition of 25 different types of probability distributions. Probability distributions play an important role in statistics and in many other fields, such as economics, engineering, and finance. They are used to model all sorts of real-world phenomena, from the weather to stock market prices. Before we get into understanding different types of probability distributions, let’s understand some fundamentals. If you are a data scientist, you would like to go through these distributions. This page could also be seen as a cheat sheet for probability distributions. What are Probability Distributions? Probability distributions are a way of describing how likely it is for a random …
Data Variables Types & Uses in Data Science
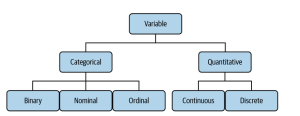
In data science, variables are the building blocks of any analysis. They allow us to group, compare, and contrast data points to uncover trends and draw conclusions. But not all variables are created equal; there are different types of variables that have specific uses in data science. In this blog post, we’ll explore the different variable types and their uses in data science. The picture below represents different types of variables one can find when working on statistics / data science projects: Lets understand each types of variables in the following sections. Categorical / Qualitative Variables Categorical variables are a type of data that can be grouped into categories, based …
Types of Frequency Distribution & Examples
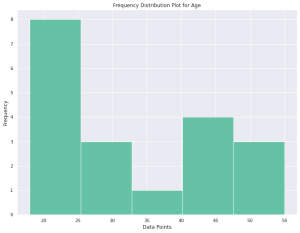
Frequency distributions are an important tool for data scientists, statisticians, and other professionals who work with data. Frequency distributions help to organize and summarize data, making it easier to identify the behavior of the data including patterns and trends. Evaluating frequency distribution is one of the important technique of univariate descriptive statistics. In this article, we’ll take a look at the concepts of the frequency distribution, its different types and provide some examples of each. What is Frequency Distribution? Frequency distribution is a statistical tool used to represent the frequency with which different categories of a qualitative or quantitative variable occur. It provides an overview of the data and allows …
Generate Random Numbers & Normal Distribution Plots
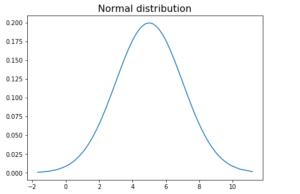
In this blog post, we’ll be discussing how to generate random numbers samples from normal distribution and create normal distribution plots in Python. We’ll go over the different techniques for random number generation from normal distribution available in the Python standard library such as SciPy, Numpy and Matplotlib. We’ll also create normal distribution plots from these numbers generated. Generate random numbers using Numpy random.randn Numpy is a Python library that contains built-in functions for generating random numbers. The numpy.random.randn function generates random numbers from a normal distribution. This function takes size N as in number of numbers to be generated as an input and returns an array of N random …
Top Python Statistical Analysis Packages
As a data scientist, you know that one of the most important aspects of your job is statistical analysis. After all, without accurate data, it would be impossible to make sound decisions about your company’s direction. Thankfully, there are a number of excellent Python statistical analysis packages available that can make your job much easier. In this blog post, we’ll take a look at some of the most popular ones. SciPy SciPy is a Python-based ecosystem of open-source software for mathematics, science, and engineering. SciPy contains modules for statistics, optimization, linear algebra, integration, interpolation, special functions, Fourier transforms (FFT), signal and image processing, and other tasks common in science and …
Covariance vs. Correlation vs. Variance: Python Examples
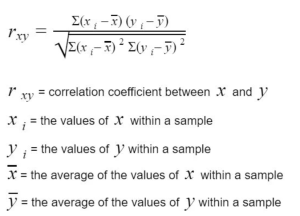
In the field of data science, it’s important to have a strong understanding of statistics and know the difference between related concepts. This is especially true when it comes to the concepts of covariance, correlation, and variance. Whether you’re a data scientist, statistician, or simply someone who wants to better understand the relationships between different variables, it’s important to know the difference between covariance, correlation, and variance. While these concepts may seem similar at first glance, they each have unique applications and serve different purposes. In this blog post, we’ll explore each of these concepts in more detail and provide concrete examples of how to calculate them using Python. What …
Central Limit Theorem: Concepts & Examples
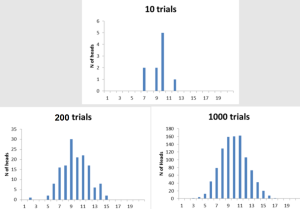
The central limit theorem is one of the most important concepts in statistics. This theorem states that, given a large enough sample size, the distribution of sample averages will be approximately normal. This is a huge deal because it means that we can use the normal distribution to make predictions about populations based on samples. In this article, we’ll explore the central limit theorem in more detail and look at some examples of how it works. As data scientists, it is important to understand the central limit theorem so that we can apply it to real-world situations. What is the central limit theorem and why is it important? The central …
Statistics – Random Variables, Types & Python Examples
Random variables are one of the most important concepts in statistics. In this blog post, we will discuss what they are, their different types, and how they are related to the probability distribution. We will also provide examples so that you can better understand this concept. As a data scientist, it is of utmost importance that you have a strong understanding of random variables and how to work with them. What is a random variable and what are some examples? A random variable is a variable that can take on random values. The key difference between a variable and a random variable is that the value of the random variable …
I found it very helpful. However the differences are not too understandable for me