In relation to machine learning, linear regression is defined as a predictive modeling technique that allows us to build a model which can help predict continuous response variables as a function of a linear combination of explanatory or predictor variables. While training linear regression models, we need to rely on hypothesis testing in relation to determining the relationship between the response and predictor variables. In the case of the linear regression model, two types of hypothesis testing are done. They are T-tests and F-tests. In other words, there are two types of statistics that are used to assess whether linear regression models exist representing response and predictor variables. They are t-statistics and f-statistics. As data scientists, it is of utmost importance to determine if linear regression is the correct choice of model for our particular problem and this can be done by performing hypothesis testing related to linear regression response and predictor variables. Many times, it is found that these concepts are not very clear with a lot many data scientists. In this blog post, we will discuss linear regression and hypothesis testing related to t-statistics and f-statistics. We will also provide an example to help illustrate how these concepts work.
What are linear regression models?
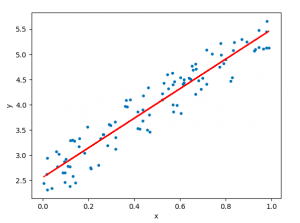
A linear regression model can be defined as the function approximation that represents a continuous response variable as a function of one or more predictor variables. While building a linear regression model, the goal is to identify a linear equation that best predicts or models the relationship between the response or dependent variable and one or more predictor or independent variables.
There are two different kinds of linear regression models. They are as follows:
- Simple or Univariate linear regression models: These are linear regression models that are used to build a linear relationship between one response or dependent variable and one predictor or independent variable. The form of the equation that represents a simple linear regression model is Y=mX+b, where m is the coefficients of the predictor variable and b is bias. When considering the linear regression line, m represents the slope and b represents the intercept.
- Multiple or Multi-variate linear regression models: These are linear regression models that are used to build a linear relationship between one response or dependent variable and more than one predictor or independent variable. The form of the equation that represents a multiple linear regression model is Y=b0+b1X1+ b2X2 + … + bnXn, where bi represents the coefficients of the ith predictor variable. In this type of linear regression model, each predictor variable has its own coefficient that is used to calculate the predicted value of the response variable.
While training linear regression models, the requirement is to determine the coefficients which can result in the best-fitted linear regression line. The learning algorithm used to find the most appropriate coefficients is known as least squares regression. In the least-squares regression method, the coefficients are calculated using the least-squares error function. The main objective of this method is to minimize or reduce the sum of squared residuals between actual and predicted response values. The sum of squared residuals is also called the residual sum of squares (RSS). The outcome of executing the least-squares regression method is coefficients that minimize the linear regression cost function.
The residual e of the ith observation is represented as the following where [latex]Y_i[/latex] is the ith observation and [latex]\hat{Y_i}[/latex] is the prediction for ith observation or the value of response variable for ith observation.
[latex]e_i = Y_i – \hat{Y_i}[/latex]
The residual sum of squares can be represented as the following:
[latex]RSS = e_1^2 + e_2^2 + e_3^2 + … + e_n^2[/latex]
The least-squares method represents the algorithm that minimizes the above term, RSS.
Once the coefficients are determined, can it be claimed that these coefficients are the most appropriate ones for linear regression? The answer is no. After all, the coefficients are only the estimates and thus, there will be standard errors associated with each of the coefficients. Recall that the standard error is used to calculate the confidence interval in which the mean value of the population parameter would exist. In other words, it represents the error of estimating a population parameter based on the sample data. The value of the standard error is calculated as the standard deviation of the sample divided by the square root of the sample size. The formula below represents the standard error of a mean.
[latex]SE(\mu) = \frac{\sigma}{\sqrt(N)}[/latex]
Thus, without analyzing aspects such as the standard error associated with the coefficients, it cannot be claimed that the linear regression coefficients are the most suitable ones without performing hypothesis testing. This is where hypothesis testing is needed. Before we get into why we need hypothesis testing with the linear regression model, let’s briefly learn about what is hypothesis testing?
Train a Multiple Linear Regression Model using R
Before getting into understanding the hypothesis testing concepts in relation to the linear regression model, let’s train a multi-variate or multiple linear regression model and print the summary output of the model which will be referred to, in the next section.
The data used for creating a multi-linear regression model is BostonHousing which can be loaded in RStudioby installing mlbench package. The code is shown below:
install.packages(“mlbench”)
library(mlbench)
data(“BostonHousing”)
Once the data is loaded, the code shown below can be used to create the linear regression model.
attach(BostonHousing)
BostonHousing.lm <- lm(log(medv) ~ crim + chas + rad + lstat)
summary(BostonHousing.lm)
Executing the above command will result in the creation of a linear regression model with the response variable as medv and predictor variables as crim, chas, rad, and lstat. The following represents the details related to the response and predictor variables:
- Response variable
- log(medv): Log of the median value of owner-occupied homes in USD 1000’s
- Predictor variables
- crim: Per capita crime rate by town
- chas: Charles River dummy variable (= 1 if tract bounds river; 0 otherwise)
- rad: Index of accessibility to radial highways
- lstat: Percentage of the lower status of the population
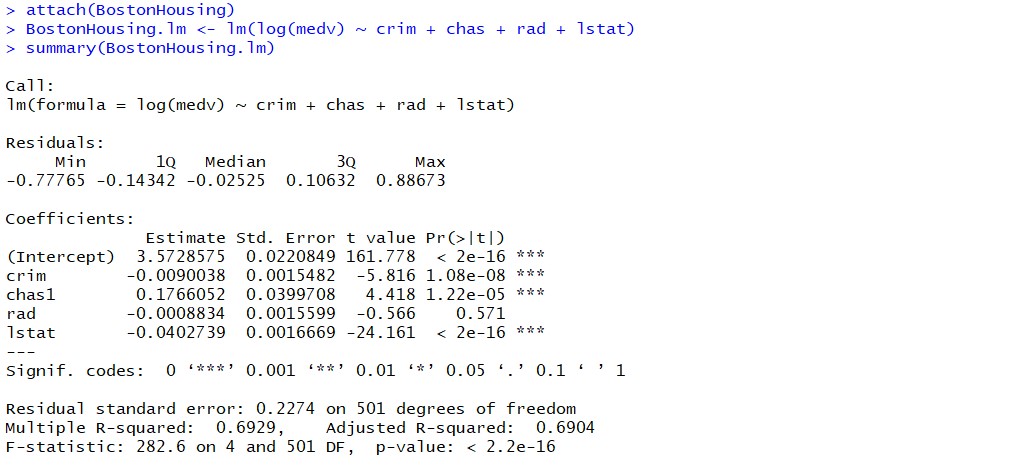
The following will be the output of the summary command that prints the details relating to the model including hypothesis testing details for coefficients (t-statistics) and the model as a whole (f-statistics)
Hypothesis tests & Linear Regression Models
Hypothesis tests are the statistical procedure that is used to test a claim or assumption about the underlying distribution of a population based on the sample data. Here are key steps of doing hypothesis tests with linear regression models:
- Formulate null and alternate hypotheses: The first step of hypothesis testing is to formulate the null and alternate hypotheses. The null hypothesis (H0) is a statement that represents the state of the real world where the truth about something needs to be justified. In other words, the claim or hypothesis made about something is nullified as it is yet to be supported by the evidence (justification). On the other hand, the alternate hypothesis (Ha) is a statement that makes a claim about something in the world.
- Hypothesis formulation for T-tests: In the case of linear regression, the claim is made that there exists a relationship between response and predictor variables, and the claim is represented using the non-zero value of coefficients of predictor variables in the linear equation or regression model. This is formulated as an alternate hypothesis. Thus, the null hypothesis is set that there is no relationship between response and the predictor variables. Hence, the coefficients related to each of the predictor variables is equal to zero (0). So, if the linear regression model is Y = a0 + a1x1 + a2x2 + a3x3, then the null hypothesis for each test states that a1 = 0, a2 = 0, a3 = 0 etc. For all the predictor variables, individual hypothesis testing is done to determine whether the relationship between response and that particular predictor variable is statistically significant based on the sample data used for training the model. Thus, if there are, say, 5 features, there will be five hypothesis tests and each will have an associated null and alternate hypothesis.
- Hypothesis formulation for F-test: In addition, there is a hypothesis test done around the claim that there is a linear regression model representing the response variable and all the predictor variables. The null hypothesis is that the linear regression model does not exist. This essentially means that the value of all the coefficients is equal to zero. So, if the linear regression model is Y = a0 + a1x1 + a2x2 + a3x3, then the null hypothesis states that a1 = a2 = a3 = 0.
- Determine the test statistics: The next step is to determine the test statistics and calculate the value.
- T-statistics for testing hypotheses related to individual coefficients: In the case of the linear regression model, the test statistics are t-statistics because the standard deviation of the sampling distribution is unknown. Otherwise, we could have as well used z-statistics. As the standard deviation of a sampling distribution is unknown, the standard error is used to estimate the coefficients. The formula of the standard error for each of the coefficients can be determined using the formula such as the following:
[latex]SE(\beta) = \frac{\sigma}{\sqrt{\sum{(x_i – \bar{x}^2)}}}[/latex]
For each coefficient, separate values of the standard error are determined, and accordingly, separate values of t-statistics are used. You may note that the greater the value of [latex]x_i[/latex], the smaller the value of standard error, the better can be the estimate of the coefficients in relation to the population value of coefficients. For each coefficient, separate one-sample t-tests are performed. Thus, if we are talking about five coefficients in a multi-linear regression model, we are talking about five one-sample t-tests, one for each predictor variable. The diagram below represents a summary table representing the outcome of training a multi-variate linear regression model having the response variable as Y and predictor variables as crim, chas, rad, lstat
Note that against each of the coefficients (crim, chas, rad, lstat), there is an estimated value along with the standard error, T-value, and P-value. The t-value can be calculated based on the formula such as (Estimated value – hypothesized value)/StandardError. For instance, for crim, the t-value is -5.816 which can be calculated as -0.0090038 / 0.0015482. The value of standard error can be calculated using the formula such as StandardDeviation of sample / square_root (number of the data sample). A P-value of 1.08e-08 for crim represents the fact the result is statistically significant. Thus, we have enough evidence based on which we can reject the null hypothesis. Thus, crim looks to be linearly related to the response variable, log(medv). - F-statistics for testing hypothesis for linear regression model: F-test is used to test the null hypothesis that a linear regression model does not exist, representing the relationship between the response variable y and the predictor variables x1, x2, x3, x4 and x5. The null hypothesis can also be represented as x1 = x2 = x3 = x4 = x5 = 0. F-statistics is calculated as a function of sum of squares residuals for restricted regression (representing linear regression model with only intercept or bias and all the values of coefficients as zero) and sum of squares residuals for unrestricted regression (representing linear regression model). In the above diagram, note the value of f-statistics as 15.66 against the degrees of freedom as 5 and 194.
- T-statistics for testing hypotheses related to individual coefficients: In the case of the linear regression model, the test statistics are t-statistics because the standard deviation of the sampling distribution is unknown. Otherwise, we could have as well used z-statistics. As the standard deviation of a sampling distribution is unknown, the standard error is used to estimate the coefficients. The formula of the standard error for each of the coefficients can be determined using the formula such as the following:
- Make decisions: Based on the values of t-statistics and f-statistics, the decision regarding the linear regression model is taken.
-
- Evaluate t-statistics against the critical value/region: After calculating the value of t-statistics for each coefficient, it is now time to make a decision about whether to accept or reject the null hypothesis. In order for this decision to be made, one needs to set a significance level, which is also known as the alpha level. The significance level of 0.05 is usually set for rejecting the null hypothesis or otherwise. If the value of t-statistics fall in the critical region, the null hypothesis is rejected. Or, if the p-value comes out to be less than 0.05, the null hypothesis is rejected.
- Evaluate f-statistics against the critical value/region: The value of F-statistics and the p-value is evaluated for testing the null hypothesis that the linear regression model representing response and predictor variables does not exist. If the value of f-statistics is more than the critical value at the level of significance as 0.05, the null hypothesis is rejected. This means that the linear model exists with at least one valid coefficients.
-
- Draw conclusions: The final step of hypothesis testing is to draw a conclusion by interpreting the results in terms of the original claim or hypothesis. If the null hypothesis of one or more predictor variables is rejected, it represents the fact that the relationship between the response and the predictor variable is not statistically significant based on the evidence or the sample data we used for training the model. Similarly, if the f-statistics value lies in the critical region and the value of the p-value is less than the alpha value usually set as 0.05, one can say that there exists a linear regression model.
Why hypothesis tests for linear regression models?
The reasons why we need to do hypothesis tests in case of a linear regression model are following:
- By creating the model, we are establishing a new truth (claims) about the relationship between response or dependent variable with one or more predictor or independent variables. In order to justify the truth, there are needed one or more tests. These tests can be termed as an act of testing the claim (or new truth) or in other words, hypothesis tests.
- One kind of test is required to test the relationship between response and each of the predictor variables (hence, T-tests)
- Another kind of test is required to test the linear regression model representation as a whole. This is called F-test.
While training linear regression models, hypothesis testing is done to determine whether the relationship between the response and each of the predictor variables is statistically significant or otherwise. The coefficients related to each of the predictor variables is determined. Then, individual hypothesis tests are done to determine whether the relationship between response and that particular predictor variable is statistically significant based on the sample data used for training the model. If at least one of the null hypotheses is rejected, it represents the fact that there exists no relationship between response and that particular predictor variable. T-statistics is used for performing the hypothesis testing because the standard deviation of the sampling distribution is unknown. The value of t-statistics is compared with the critical value from the t-distribution table in order to make a decision about whether to accept or reject the null hypothesis regarding the relationship between the response and predictor variables. If the value falls in the critical region, then the null hypothesis is rejected which means that there is no relationship between response and that predictor variable. In addition to T-tests, F-test is performed to test the null hypothesis that the linear regression model does not exist and that the value of all the coefficients is zero (0). Learn more about the linear regression and t-test in this blog – Linear regression t-test: formula, example.

Check out my latest book titled as First Principles Thinking: Building winning products using first principles thinking.
- Mathematics Topics for Machine Learning Beginners - July 6, 2025
- Questions to Ask When Thinking Like a Product Leader - July 3, 2025
- Three Approaches to Creating AI Agents: Code Examples - June 27, 2025
Very informative