
Poisson distribution is a probability distribution that can be used to model the number of events in a fixed interval. It is often referred to as “random poisson process” or “poisson process”. The poisson distribution describes how many occurrences of an event occur within a given time frame, for example, how many customers visit your store or restaurant every hour. In this post, you will learn about the concepts of Poisson probability distribution with Python examples. As a data scientist, you must get a good understanding of the concepts of probability distributions including normal, binomial, Poisson etc.
What is Poisson distribution?
Poisson distribution is the discrete probability distribution which represents the probability of occurrence of an event r number of times in a given interval of time or space if these events occur with a known constant mean rate and are independent of each other. This type of probability is used in many cases where events occur randomly, but with a known average rate. The number of events that happen during an interval is dependent on the time elapsed rather than the total time available. The Poisson distribution can be applied to time-sensitive processes such as text messages sent per minute and phone calls received per second. Poisson distribution can help us determine how often we may expect an “event” such as finding customers in line or the number of accidents that occur per hour.
The following are the key criteria that the random variable follows the Poisson distribution.
- Individual events occur at random and independently in a given interval. This can be an interval of time or space.
- The mean number of occurrences of events in an interval (time or space) is finite and known. The mean number of occurrences is represented using [latex]\lambda[/latex]
The random variable X represents the number of times that the event occurs in the given interval of time or space. If a random variable X follows Poisson distribution, it is represented as the following:
X ~ Po([latex]\lambda[/latex])
In the above expression, [latex]\lambda[/latex] represents the mean number of occurrences in a given interval. Mathematically, the Poisson probability distribution can be represented using the following probability mass function:
[latex]\Large P(X=r) = \frac{e^{-\lambda}*\lambda^r}{r!}[/latex]
.
In the above formula, the [latex]\lambda[/latex] represents the mean number of occurrences, r represents different values of random variable X.
Expectation & Variance of Poisson Distribution
The expected value and variance of a Poisson random variable is one and same and given by the following formula. [latex]\lambda[/latex] is the mean number of occurrences in an interval (time or space)
[latex]\Large E(X) = \lambda[/latex]
.
[latex]\Large Var(X) = \lambda[/latex]
.
Poisson Distribution Explained with Real-world examples
Here are some real-world examples of Poisson distribution.
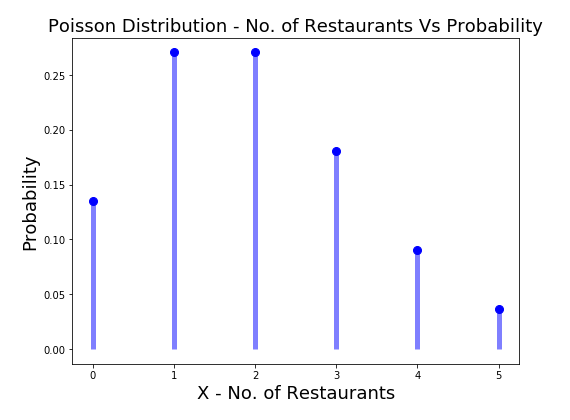
- Poisson distribution for Space interval: Let’s say that you are out on a long drive. The rate of occurrences of good restaurants in a range of 10 miles (or km) is 2. In other words, the mean number of occurrences of restaurants in a range of 10 KM or miles is 2. What is the probability that 0, 1, 2, 3, 4, or 5 restaurants will occur in the next 10 km.

Here is how the Python code will look like, along with the plot for the Poisson probability distribution modeling the probability of the different number of restaurants ranging from 0 to 5 that one could find within 10 KM given the mean number of occurrences of the restaurant in 10 KM is 2. Scipy.stats Poisson class is used along with pmf method to calculate the value of probabilities.
from scipy.stats import poisson
import matplotlib.pyplot as plt
#
# Random variable representing number of restaurants
# Mean number of occurences of restaurants in 10 KM is 2
#
X = [0, 1, 2, 3, 4, 5]
lmbda = 2
#
# Probability values
#
poisson_pd = poisson.pmf(X, lmbda)
#
# Plot the probability distribution
#
fig, ax = plt.subplots(1, 1, figsize=(8, 6))
ax.plot(X, poisson_pd, 'bo', ms=8, label='poisson pmf')
plt.ylabel("Probability", fontsize="18")
plt.xlabel("X - No. of Restaurants", fontsize="18")
plt.title("Poisson Distribution - No. of Restaurants Vs Probability", fontsize="18")
ax.vlines(X, 0, poisson_pd, colors='b', lw=5, alpha=0.5)
Here is how the plot representing the Poisson probability distribution of number of restaurants occurring in the range of 10 kms would look like:
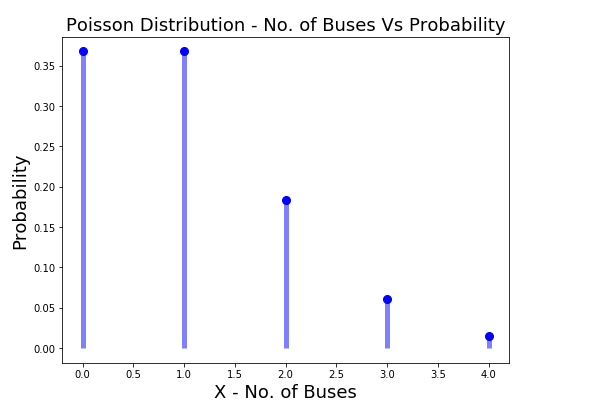
- Poisson distribution for Time interval: Let’s say that the number of buses that come on a bus stop in span of 30 minutes is 1. Poisson distribution can be used to model the probability of different number of buses, X, coming to the bus stop within the next 30 minutes where X can take value of 0, 1, 2, 3, 4.

Here is how the Python code will look like, along with the plot for the Poisson probability distribution modeling the probability of a different numbers of buses ranging from 0 to 4 that could arrive on the bus stop within 30 min given the mean number of occurrences of buses in 30 min interval is 1.
from scipy.stats import poisson
import matplotlib.pyplot as plt
#
# Random variable representing number of buses
# Mean number of buses coming to bus stop in 30 minutes is 1
#
X = [0, 1, 2, 3, 4]
lmbda = 1
#
# Probability values
#
poisson_pd = poisson.pmf(X, lmbda)
#
# Plot the probability distribution
#
fig, ax = plt.subplots(1, 1, figsize=(8, 6))
ax.plot(X, poisson_pd, 'bo', ms=8, label='poisson pmf')
plt.ylabel("Probability", fontsize="18")
plt.xlabel("X - No. of Buses", fontsize="18")
plt.title("Poisson Distribution - No. of Buses Vs Probability", fontsize="18")
ax.vlines(X, 0, poisson_pd, colors='b', lw=5, alpha=0.5)
Here is how the Poisson probability distribution plot would look like representing the probability of different number of buses coming to the bus stop in next 30 minutes given the mean number of buses that come within 30 min on that stop is 1.
Here are few other examples of Poisson distribution.
- The number of customers visiting the supermarket: In a supermarket, how many customers visit the store per day is an example of Poisson distribution. If the average number of customers visiting a supermarket on weekdays is 50, then knowing this information can help the store managers decide how many staff members are needed for serving the customers.
- The number of phone calls in the call center: The number of phone calls received by a call center in one day can be considered as an example of a Poisson distributed random variable. In this case, it will help to determine whether or not there are any irregularities that need immediate attention from managers.
- The number of defective items produced by a factory: The number of defective goods that are made in one production run can be considered as an example of Poisson distribution. This is important for quality control purposes to ensure that customers are getting the right kind and quantity of products they pay for. If the average number of defective items produced by the factory per day is ten, then this information can be used to determine how many inspectors are needed for checking these goods or if there needs to be an increase in production capacity.
- The total rainfall received at a particular place during summer: The Poisson distribution helps us model the amount of rain that falls on a particular area during the summer. If the average total rainfall received by a place in summers is 100mm, then knowing this information can help people plan for more water storage facilities or rainwater harvesting systems to avoid inconveniences of water scarcity.
- The number of phone calls that are made on an online chat service: The number of phone calls made using an online chat service in one hour can be considered as an example of a Poisson distributed random variable. In this case, it will help to determine whether or not there are any irregularities that need immediate attention from managers.
- The number of students enrolling for a particular course offered by the college: The number of students who register for a certain class at a college can be considered as an example of Poisson distribution. This information is helpful to determine the number of teaching staff required for each class and other facilities like classrooms, computers, etc that are needed.
- The number of accidents on a particular route per day: The number of car accidents that occur on expressways or highways per day can be considered as an example of Poisson distribution. This is because the number of accidents is unpredictable and random in nature. If the average rate at which they occur is five, then knowing this information can help determine if there are any dangerous curves or other factors that contribute to these accidents and need immediate attention from road engineers.
- The number of angry customers at a bank: The number of frustrated customers who show up at banks to lodge complaints or raise their concerns about specific issues should also follow the Poisson distribution pattern. This is because the number of angry customers who come and go on a daily basis depends largely on factors such as weather, traffic condition, etc.
Conclusions
Here is the summary of what you learned in this post in relation to Poisson probability distribution:
- Poisson distribution is a discrete probability distribution.
- The probability of occurrences of an event within an interval (time or space) is measured using Poisson distribution given that the individual events are independent of each other and the mean number of occurrences of the event in the interval is finite.
- The expectation and variance of the random variable following Poisson distribution is the same as the mean number of occurrences of an event in the given interval (time or space)

Check out my latest book titled as First Principles Thinking: Building winning products using first principles thinking.
- Mathematics Topics for Machine Learning Beginners - July 6, 2025
- Questions to Ask When Thinking Like a Product Leader - July 3, 2025
- Three Approaches to Creating AI Agents: Code Examples - June 27, 2025
Well exemplified!