
In this post, you will learn the concepts of Z-Score with the help from examples including Christiano Ronaldo and Robert Lewandowski. You will learn about how to compare and call out whose performance was better in Champions League 2019-2020. As a data scientist, it will be extremely important to learn the concepts of Z-Scores, also called as Standard scores, as it would help you evaluate / compare a particular data set with past data set.
Before getting into the example of Z-scores, lets understand some concepts of Z-scores.
What’s Z-Score or Z-statistics?
Z-score can be defined as number of standard deviations the data point is above or below the mean of the data points (be it sample or population). Z-score or Z-statistics allows to perform hypothesis testing for the following different scenarios given the population standard deviation is know:
- Check whether the sample belongs to the population by compare sample mean from that of population mean (1 sample Z-test)
- Check whether there is difference between two samples coming from two different populations (Two-samples Z-test for means)
- Check whether the sample proportion is different from the population proportion (1 sample Z-test for proportion)
- Check whether there is difference between two samples proportion (two samples Z-test for proportion)
Z-Score Explained with Example
In this section, we will learn about Z-score and their usage using the example related to evaluating the performance of Ronaldo and Robert in Champions League matches in 2019-2020.

In Champion’s league 2019-2020, here is the data related to their performance (ESPN.in).
| Player | No. of Matches Played | No. of Goals Scored | Avg Goals / Matches |
| Christiano Ronaldo | 8 | 4 | 0.5 |
| Robert Lewandowski | 10 | 15 | 1.5 |
.
Well, the average goals/match indicates that Robert Lewandowski played much better than Christiano Ronaldo. However, can we conclude the same using statistical measures? How could we find out if they performed better than their own performance over the last 7-8 years? This is where Z-Score comes into the picture.
In the above evaluation, what is used to compare the performance is average goals / matches. Although the numbers say that Robert Lewandowski played much better than Ronaldo. But is this an actionable insight? Is this comparison enough for me to put my money on Robert for next year? Is he really playing better than his last performance?
Let’s take this hypothetical scenario. What if it is said that Robert’s statistics for average goals/matches in the last 7-8 years have been 1.2 goals/match with a standard deviation of 0.5 goals and Ronaldo’s statistics is 0.4 goals/match with a standard deviation of 0.2 goals. What would these numbers speak about their performance in 2019-2020 matches in comparison to their past performances? In order to evaluate the performance of each player in comparison to their past performances, what is needed is a standard way of evaluating their performance. This is where the concept of Z-Score comes into the picture. Z-score is also called a standard score.
In order to evaluate their performance in comparison to their past performances, Z-score or standard score is calculated. Z-score is a mechanism using which one can compare two different data sets having different means and standard deviations. Z-score or standard score will be used to evaluate both Ronaldo and Robert’s performance relative to their personal past performance. We can calculate the standard scores related to their performance in 2019-2020 and use the scores for the evaluation.
Let’s use the Z-score formula to calculate the standard score or z-score of Ronaldo and Robert for their performance in 2019-2020. As a first step, we will calculate the mean and standard deviations of their average goals/matches across different seasons for last 7-8 years or so. In the table below, CR represents Christiano Ronaldo, RL represents Robert Lewandowski, P represents No. of games played, and G represents No. of goals scored,
| Years | CR_P | CR_G | CR_Avg | RL_P | RL_G | RL_Avg |
| 2018 | 9 | 6 | 0.67 | 8 | 8 | 1.0 |
| 2017 | 13 | 15 | 1.15 | 11 | 5 | 0.45 |
| 2016 | 13 | 12 | 0.92 | 9 | 8 | 0.89 |
| 2015 | 12 | 16 | 1.33 | 12 | 9 | 0.75 |
| 2014 | 12 | 10 | 0.83 | 12 | 6 | 0.50 |
| 2013 | 11 | 17 | 1.55 | 9 | 6 | 0.67 |
| 2012 | 12 | 12 | 1.0 | 13 | 10 | 0.77 |
From above, the mean and standard deviation of average goals/matches across different seasons for both Christiano Ronaldo and Robert Lewandowski can be calculated. I used Python Numpy to do the same. Here is the code:
cr_avg = np.array([0.67 ,1.15, 0.92, 1.33, 0.83, 1.55, 1.0])
rl_avg = np.array([1.0, 0.45, 0.89, 0.75, 0.50, 0.67, 0.77])
#
# Christiano Ronaldo Mean and Standard Deviation
#
print('Christiano Ronaldo: ', round(cr_avg.mean(), 2), round(cr_avg.std(), 2))
#
# Christiano Ronaldo Mean and Standard Deviation
#
print('Robert Lewandowski: ', round(rl_avg.mean(), 2), round(rl_avg.std(), 2))
The mean ([latex]\mu_{CR}[/latex]) and standard deviation ([latex]\sigma_{CR}[/latex]) for Christiano Ronaldo is 1.06 and 0.28.
The mean ([latex]\mu_{RL}[/latex]) and standard deviation ([latex]\sigma_{RL}[/latex]) for Robert Lewandowski is 0.72 and 0.18
From the above, it can be said that Ronaldo has a better goal scoring average across different seasons than Robert Lewandowski. That said, let’s see how they performed in comparison to their past performances.
Based on the above data, we will calculate the standard scores related to average goals/matches of the year 2019 for both Ronaldo and Robert and evaluate/compare their performance.
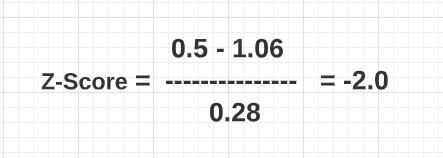
Z-score or Standard score for Ronaldo performance in 2019 can be calculated as the following. Note 0.5 is Ronaldo’s average goals/matches in 2019 shown in table 1.
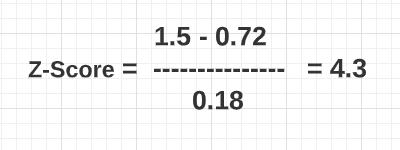
Z-score or Standard score for Robert performance in 2019 can be calculated as the following. Note 1.5 is Robert’s average goals / matches in 2019 shown in table 1.
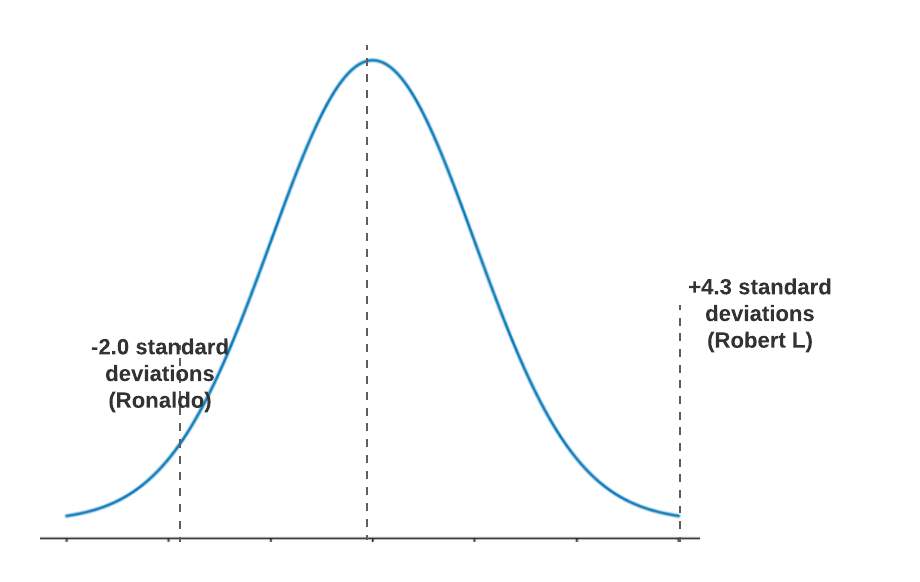
From above, it can be easily determined that Robert performance is way better than Ronaldo. Pictorially, the standard scores for Ronaldo and Robert when shown on standard normal distribution looks like the following:
Whose performance is better?
The standard score for Ronaldo for 2019 is -2.0, while the standard score for Robert L is 4.3. It is evident that after the scores are standardized, it can be concluded that the score for Robert L is higher.
This means that even though Ronaldo is found to have better average goals/matches scores across different seasons in the last 7 years, it is Robert Lewandowski performed a lot better in 2019 relative to his own past performances and Ronaldo performed a lot poor than his past performance.
Conclusions
Here is the summary of what you learned about the Z-score or standard score:
- Z-score is a method used for standardizing the scores measured on different scales.
- Z-score can be used to evaluate the performance of an entity in comparison to his / her past performance.

Check out my latest book titled as First Principles Thinking: Building winning products using first principles thinking.
- Mathematics Topics for Machine Learning Beginners - July 6, 2025
- Questions to Ask When Thinking Like a Product Leader - July 3, 2025
- Three Approaches to Creating AI Agents: Code Examples - June 27, 2025
Lovely example Ajitesh. Would it be ok if I used it in my teaching (with reference to this page of course)? Thanks
Thanks Jenny. Please feel free.
Thanks