In statistics, a two-sample z-test for proportions is a method used to determine whether two samples are drawn from the same population. This test is used when the population proportion is unknown and there is not enough information to use the chi-squared distribution. The test uses the standard normal distribution to calculate the test statistic. As data scientists, it is important to know how to conduct this test in order to determine whether two proportions are equal. In this blog post, we will discuss the formula and examples of the two-proportion Z-test.
What is two proportion Z-test?
A two-proportion Z-test is a statistical hypothesis test used to determine whether two proportions are different from each other. While performing the test, Z-statistics is computed from two independent samples and the null hypothesis is that the two proportions are equal. In other words, the two samples are coming from the same population. In order to be able to use the two-sample z-test, the following conditions must be met:
- The two populations must be normal or approximately normal
- The two samples must be randomly sampled from the two populations
- The two proportions must be independent
If any of the above conditions are not met, the two-sample z-test cannot be used and another test must be selected. The two-sample z-test is advantageous because it does not require any knowledge of the population standard deviation.
There are two steps in conducting a two-sample z-test for proportions.
- The first step is to calculate the standard error of the difference between the two population proportions.
- The second step is to calculate the z-test statistic. This is done by taking the difference between the two population proportions and dividing it by the standard error of the difference.
Once the z-test statistic is calculated, the Z-table can be used to determine whether the two population proportions are different. If the z-statistic is greater than or equal to the critical value or level of significance, then it can be concluded that there is enough evidence that there exists a difference between the two population proportions. And, the null hypothesis can thus be rejected.
Here are some real-world examples where two proportions Z-test can be used:
- Effectiveness of medicines: In a study, two different groups of people are given the same medicine. The proportion of people in each group who get better is measured. A two-proportion Z-test can be used to see if the proportions are different (i.e. one group might have a higher success rate than the other).
- Election results: In an election, two different political parties are running. The number of people who voted for each party is measured. A two-proportion Z-test can be used to see if the proportions are different (i.e. one party might have more support than the other).
- Customer purchase behavior: In a study, two different groups of customers are observed. The proportion of customers in each group who buy something is measured. A two-proportion Z-test can be used to see if the proportions are different (i.e. one group might be more likely to buy than the other).
- Customer survey result: A company sends out customer surveys to customers from two different regions. The proportion of people who respond from each region is measured. A two-proportion Z-test can be used to see if the proportions are different (i.e. one region might have more positive response than the other).
- A/B testing: In market research, two different versions of a product (A and B) are tested on two different groups of people. The proportion of people who think each version is better is measured. A two-proportion Z-test can be used to see if the proportions are different (i.e. one group might like Version A more than Version B).
Two sample Z-test for proportions: Formula
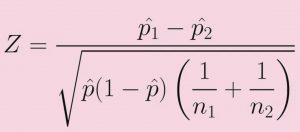
The following is the formula for two-sample Z-test for proportions:
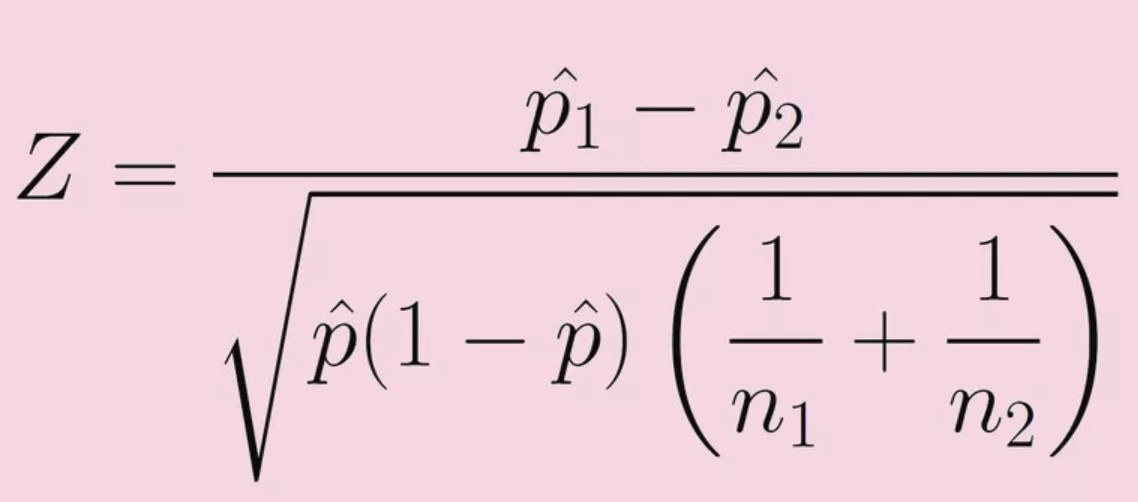
p1-hat is the proportion of the 1st sample
p2-hat is the proportion of the 2nd sample
n1 is number of data samples in the 1st sample
n2 is number of data samples in the 2nd sample
p-hat is mean of both the samples; If k1 is successes out of n1 data in sample1 and k2 is successes out of n2 data in sample2, then the value of p-hat can be calculated as the following:
p-hat = (k1 + k2)/(n1 + n2)
In the above formula, the hypothesized difference between population proportions is 0.
Two sample Z-test for proportions: Examples
Let’s learn the two-proportion Z-test with an example. You could use a two-proportion Z-test to determine if the proportion of people who responded positively to the medicine is different between the two groups. On one sample of 200 people, 130 people responded positively, and on another sample of 100 people, 50 people responded positively to the medicine.
P1 = 130/200 = 0.65, N1 = 200
P2 = 50/100 = 0.5, N2 = 100
P = (130 + 50)/(200 + 100) = 180/300 = 0.6
Z-score = (P1 – P2)/SQRT[P*(1-P)]*SQRT[(1/N1) + (1/N2)]
= (0.65 – 0.5)/SQRT[0.6*(1-0.6)]*SQRT[(1/200) + (1/100)]
= 0.15/SQRT[0.6*0.4]*SQRT[0.005 + 0.01]
= 0.15/SQRT[0.24]*SQRT[0.015]
= 0.15/(0.49*0.1225)
= 0.15/0.06
Z-score = 2.5
The p-value for the two-tailed test comes out to be less than 0.0124. For a significance level of 0.05, the test outcome is statistically significant as P-value is less than 0.05. Thus, the difference in response to the medicine needs to be further investigated.
Summary
The two-sample z-test for proportions is a statistical test that can be used to determine if two proportions are different. The test is advantageous because it does not require any knowledge of the population’s standard deviation. In order to use two proportions Z-test, the two populations must be normal or approximately normal and two samples must be independent and randomly sampled from the two populations. The two-sample z-test is commonly used in real-world examples such as determining the effectiveness of medicines, election results, customer purchase behavior, and A/B testing.

Check out my latest book titled as First Principles Thinking: Building winning products using first principles thinking.
- Three Approaches to Creating AI Agents: Code Examples - June 27, 2025
- What is Embodied AI? Explained with Examples - May 11, 2025
- Retrieval Augmented Generation (RAG) & LLM: Examples - February 15, 2025
Hi Sir, SHouldn’t N2 be 100
Thanks Srinath for pointing that out. Corrected it
Hi Ajitesh,
You corrected N2 and forgot to correct P = (130 + 50)/(200 + 100)
Thank you. Done
Also, the Z-Score equation needs to be updated with the new N2.
Done! Thank you
In the third row of Z-score calculation you wrote that 1/100 = 0.001 while it should be 0.01. Final Z-score should be 2.5 I believe.
Thank you Luka. This is corrected.
Hello, the standard error calculations needs to be updated starting from here;
00.15/SQRT[0.6*0.4]*SQRT[0.005 + its 0.001 instead of 0.01]
= 0.15/SQRT its [0.18] instead of 0.24 *SQRT its [0.006] instead of 0.015
= all that is affecting this and below findings too …..0.15/(0.424*0.0775)
= 0.15/0.0328
Z-score = 4.573 this supposed to be 2.5
Thanks a ton, John for pointing it out. Corrected!