One sample Z-test for means is one of the statistical techniques used for testing hypothesis related to whether the sample belongs to a population. As a data scientist, you must get a good understanding of the z-test and its applications to test the hypothesis for your statistical models. In this blog post, we will discuss the one sample z-test for means and its concepts with an example. You may want to check my post on hypothesis testing titled – Hypothesis testing explained with examples
What is One-sample Z-test for Means?
Z-test is usually referred to as a 1-sample Z-test for means that is used to test the hypothesis about the sample belonging to the population given that the standard deviation of the sampling distribution is known as a function of population’s standard deviation. Recall that the sampling distribution represents the distribution of different samples taken from the population to perform hypothesis testing. One sample Z-test for means involves comparing sample mean with known population parameter (mean). In other words, Z-test is used to test whether the sample belongs to a population, or comes from a population on the basis of z-statistics or Z-score. The null hypothesis is set as the claim that the sample belongs to the population and there is no difference between the sample and the population. Based on the value of z-statistics or Z-score, it is determined whether to reject the null hypothesis or otherwise, particularly if the z-statistic falls in the rejection region (rejection boundary) in the Z-distribution or standard normal distribution. The figure below represents the aspect of using Z-test for comparing sample mean (blue region) with population mean (red region) in the sampling distribution. The assumption for Z-test is the data comes from the normal distribution.

In relation to performing hypothesis testing for comparing sample means with that of population, Z-statistics or Z-score is a statistics that is used to measure how far the sample mean deviates from the population mean in terms of the number of population standard deviations (also called as the standard error of the mean – SE) and whether the deviation is statistically significant. Z-statistics can be used in different hypothesis testing techniques, such as one sample and two samples z-tests for means and proportions. In the case of hypothesis testing for the one-sample and two-samples, the sampling distribution is considered for calculating Z-statistics, and, this is why the sample mean, the population mean, and the standard error of the mean (SE) of the sampling distribution is required. Also, note that the sample statistics such as mean, variance, the standard deviation do depend upon the probability distribution. The formula for the Z-statistics is following when considering one-sample Z-test:
Z = (x – µ)/SE
In this case, Z represents the Z-statistic, x is the sample mean, SE represents the standard error of the sample mean of the sampling distribution, and µ represents the population mean. The population mean can fall anywhere between the upper bound value from a confidence interval for the population mean (µ) and the lower bound value from the same confidence level for µ. The confidence interval represents the margin of error. The margin of error is a statistic that is computed from the standard error of the sampling distribution and it represents how confident we are about our estimate of the population parameter.
The formula for the standard error of the sample mean of sampling distribution is following:
SE of the mean = (StandardDeviation of Population) / SQRT(N)
In this case, N represents the number of observations in the given sample and SQRT represents square root. When the standard deviation of the population mean is not known, what is taken into consideration is an estimate of the standard error of the mean and that is calculated as the function of the standard deviation of the sample. The test is called the T-test. This will be considered in another blog post.
Z-score can be used to estimate the proportion or mean of the population based on the sample mean and the confidence interval. The following is the formula for Z-score for estimating the population mean:
Population mean = Sample mean +- MarginOfError (MOE) or Confidence interval (CE)
The confidence interval or true margin of error can be calculated as the following:
MOE or CE = Z*StandardDeviationOfSamplingDistribution
StandardDeviationOfSamplingDistribution = StandardDeviationOfPopulation / SQRT(N)
For a desired confidence interval, Z-score is determined from Z-table. For a confidence interval of 95%, Z-score is 1.96. This means that if different samples are taken and the population mean is calculated, for 95% of cases, the population mean will fall in the given CE range.
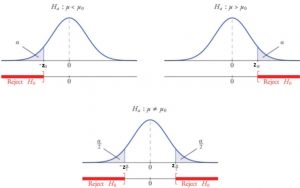
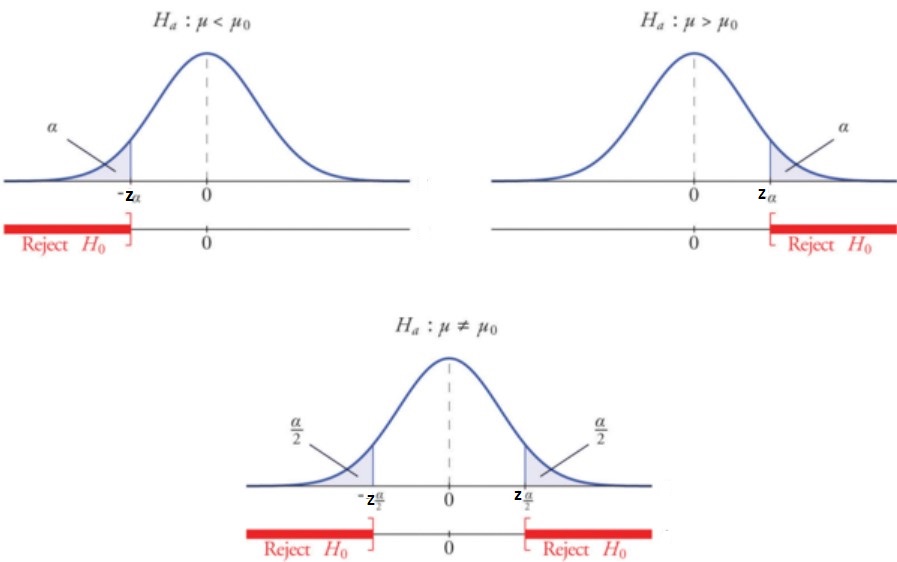
One sample Z-test for means can be used in for both one-tailed tests and two-tailed tests. The one-tailed hypothesis test is defined as a hypothesis test where the direction of the alternative hypothesis is known in advance. For example, in a study to determine whether there is a difference in the average wait time for customers at two restaurants, the alternative hypothesis would be that the wait time is shorter at Restaurant A than at Restaurant B. The one-tailed test allows us to make a directional prediction about the population parameter and it can be either left or right-tailed. In contrast, the two-tailed hypothesis test is defined as a hypothesis test where the direction of the alternative hypothesis is not known in advance. In this case, we compare both scenarios for testing whether there exists any difference between two population means or one does not exist. For example, in an experiment to determine how much impact taking supplements has on improving memory power and concentration level compared with placebo, the two-tailed test would be appropriate for this experiment. The figure below the aspects relation to one-tailed (left-tailed & right tailed) and two-tailed tests and rejection regions in the standard normal distribution or Z-distribution.
Summary
One-sample Z-test for means is a statistical hypothesis testing technique that can be used to perform hypothesis testing for comparing a sample or group with respect to the population in relation to mean. It helps us determine whether there exists any difference between the sample and the population means. The pre-requisite for using one-sample Z-test for means is that data must belong to normal distribution and the population standard deviation is known. In case, the population standard deviation is unknown, t-test gets used. The z-test for hypothesis testing will help you make confident decisions about your data. To learn more about z-tests, z tests for proportions, z tests of two proportions, continue reading future blogs. Please feel free to leave comments or contact us with any questions.

Check out my latest book titled as First Principles Thinking: Building winning products using first principles thinking.
- Questions to Ask When Thinking Like a Product Leader - July 3, 2025
- Three Approaches to Creating AI Agents: Code Examples - June 27, 2025
- What is Embodied AI? Explained with Examples - May 11, 2025
I found it very helpful. However the differences are not too understandable for me