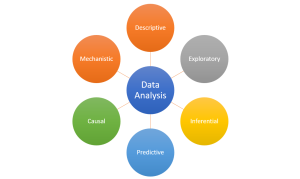
Data analysis plays an important role in understanding the world, discovering trends, and making decisions. Having a good understanding of the different types of data analysis available is essential for anyone looking to make sense of their data. In this blog post, we’ll discuss the six different forms of data analysis and provide examples of each type so you can get a better idea of how they work. The following is a representation of six forms of data analysis.

Before getting ahead and understand different form of analysis, lets understand what is Data Analysis?
The word “analysis” comes from the Ancient Greek ἀνάλυσις (analysis, “a breaking-up” or “an untying;” from ana- “up, throughout” and lysis “a loosening”).
Based on the above, when we say that we are analyzing a problem, or performing analysis of a problem, we are essentially saying that we breaking or loosening the problem into further parts for better understanding of the problem. And, if we use data as part of the problem analysis or breaking down the problem into sub-problems for better understand, this act can be termed as Data Analysis.
Descriptive Data Analysis
One of the most common forms of data analysis is descriptive data analysis. As the name suggests, descriptive data analysis helps in breaking down the problems into sub-problems and describing different aspects of problem / sub-problem using question such as “What is”. For example, descriptive data analysis around sales will help understand sales by answering questions such as what was the sale across different regions, time duration etc.
Descriptive analysis involves analyzing and summarizing the metrics in a dataset including central tendency measures such as mean / median / mode, standard deviation, total count, minimum and maximum value, Q1, Q3, interquartile range, standard deviation, variance, standard error etc. Descriptive analysis also helps understand the shape of the data using measures such as skew, kurtosis, etc. For those working with Python Pandas package, describe function is used to provide descriptive summary of the data.
Exploratory Data Analysis
Exploratory data analysis is a valuable tool for uncovering patterns, trends, and insights about any problem or thing using data. It involves analyzing a dataset in order to gain understanding of the problem without making any assumptions. Unlike standard statistical methods, it does not require hypotheses or prior assumptions about the data. Instead, it allows data analysts / data scientists to take an exploratory approach by exploring different aspects of the data to discover new relationships and uncover potential problems or biases.
Exploratory data analysis (EDA) is typically used at the beginning of a project before more rigorous methods are applied. Through graphics, visualizations and basic statistical analyses, EDA helps to understand how variables in a dataset are related to each other, as well as how they vary over time or across different groups. EDA helps us challenge or confirm our assumptions about the data. It can help researchers form hypotheses about which factors may influence outcomes or uncover patterns and structures that may not be evident when looking at summary statistics alone. For example, if researchers wanted to explore whether there was a relationship between income level and education attainment in an area, they could use scatter plots and examine correlations between these two variables.
EDA can help highlight gaps in our knowledge about the thing / system and help determine which experiments might make sense to run to fill in those gaps.
Inferential Data Analysis
Inferential data analysis is a type of statistical analysis used to draw conclusions about a population based on the information gathered from a sample. It is important to note that inferential data analysis does not provide direct evidence, but instead only provides an approximation of what may be true for the population as a whole. By taking a random sample from the population and analyzing it, inferential data analysis can provide insight into how the entire population may behave. This type of statistical conclusion making is often used in research and decision-making, where exact conclusions about entire populations are not readily available or practical.
Inferential analysis sets the stage for hypothesis testing and the experiments are design and run to test and analyze the understanding of the underlying mechanisms.
Why is inferential analysis needed?
The importance of inferring about the population based on the sample is important because it is expensive to collect the data for entire population and run the analysis. Apart from being expensive, it is impractical as well to collect the population data.
An example of inferential data analysis can be seen in the study of air pollution and life expectancy at the state level in the United States. In this case, researchers collected air quality measurements from various locations across multiple states in order to measure levels of pollutants present in each region. They then compared these values with corresponding life expectancies in each state to see if there was a correlation between air pollution levels and average life expectancy. Because an exact measurement or conclusion could not be made for all states across the US due to practical constraints, researchers resorted to inferring potential relationships between air quality and life expectancy by analyzing a sample set of measurements from across different states. By doing so, they were able to draw conclusions about how changes in air pollution may affect overall longevity at the national level without having tested every single location within each state.
Inferential analysis can help answer some of the following questions:
- Confidence interval, standard error, margin of error
- Expected mean of single sample: Is the sample mean different from the expected mean?
- Difference of means from two samples
- Data distribution
- Regression
- Goodness of fit and association
Predictive Data Analysis
Predictive data analysis is an invaluable tool for businesses, researchers, and others who seek to understand the underlying factors that lead to certain outcomes. Predictive data analysis uses a variety of algorithms and statistical techniques to analyze large data sets and uncover patterns or relationships that can be used to predict future outcomes.
In many cases, predictive data analysis relies on machine learning techniques such as artificial neural networks and decision trees. Machine learning algorithms use training datasets to learn the characteristics of existing data points and build models that can then be used to make predictions about new data points. For instance, a business may use predictive analytics to identify new customers who have similar purchasing behavior as current customers, using a combination of demographic information, past purchases, and other details obtained from past transactions.
Causal Data Analysis
Causal data analysis is the practice of investigating relationships between two or more variables to identify if a change in one variable causes a change in the other on average. Causal analysis seeks to understand both the magnitude and direction of relationships between variables on average. Causal analysis requires a thorough examination of empirical evidence, including quantitative and qualitative data. By identifying correlations between variables, it can be determined whether changes in one variable cause changes in the other, or merely reflect a shared underlying factor.
For example, many studies have been conducted on the link between smoking and cancer. The evidence from these studies has demonstrated a strong causal relationship between smoking and cancer; that is, smoking causes an increase in cancer risk. This causal effect occurs because when someone smokes, their body is exposed to numerous carcinogenic chemicals which cause damage to cells and increase the risk of developing certain types of cancers.
Another example of a causal relationship is relationship between poverty and health outcomes. Numerous studies have shown that living in poverty increases one’s risk for myriad physical and mental health conditions, due to factors such as poor diet, inadequate access to medical care, exposure to environmental hazards, and increased stress levels (all of which are exacerbated by living under economic duress). In essence, poverty has been shown to significantly contribute to poorer overall health outcomes across numerous dimensions.
Mechanistic Data Analysis
Mechanistic data analysis is a scientific method used to identify the causal relationships between two variables. This approach focuses on studying how changes in one variable affect another variable in a deterministic way.
Mechanistic data analysis is widely used in engineering studies. Engineers use this method to analyze how changes in a system’s components affect its overall performance and then develop mathematical models based on their observations to predict the system’s performance under different conditions. For example, engineers might measure how changes in engine design parameters such as piston size, fuel injection rate, exhaust pressure, or number of cylinders affect engine power output or fuel efficiency to help optimize engine designs for improved performance and efficiency in vehicles.
Conclusion
Data analysis has become an essential tool for uncovering valuable insights from large datasets quickly and accurately. The six different types of data analysis — descriptive, exploratory, inferential, predictive, causal and mechanistic — all have their own unique strengths that can be leveraged depending on your specific needs or goals when it comes to analyzing your data. By understanding the basics behind each type of data analysis method you can gain insights into how best utilize them moving forward so you can make effective decisions based on your findings with confidence

Check out my latest book titled as First Principles Thinking: Building winning products using first principles thinking.
- Mathematics Topics for Machine Learning Beginners - July 6, 2025
- Questions to Ask When Thinking Like a Product Leader - July 3, 2025
- Three Approaches to Creating AI Agents: Code Examples - June 27, 2025
I found it very helpful. However the differences are not too understandable for me