
In today’s data-driven world, data analytics has become a key aspect of business decision making. Organizations are increasingly relying on data analytics to gain insights into their operations and customers, in order to drive growth and profitability. However, the challenge for many businesses is not in understanding the importance of analytics, but in identifying the right use cases for their particular business problems, execute those use cases and deliver in a timely manner. This is where a structured approach to identifying analytics use cases becomes critical. In this blog post, we will explore how product managers and data scientists can work with business owners and identify analytics use cases that are relevant to their specific business problems, and how they can go about implementing these use cases for maximum impact. Whether you are new to analytics or looking to expand your existing analytics capabilities, this blog post will provide you with practical tips and guidance on how to identify analytics use cases for business problems.
1. Understanding Business Objectives – Strategic or Tactical
Understanding business objectives (Strategic or Tactical) is an essential part of identifying analytical use cases. When organizations start working on their analytics projects, they need to first thoroughly understand the business objectives they want to achieve through one or more of their data analytics projects. There are two main types of business objectives that can be identified: strategic and tactical.
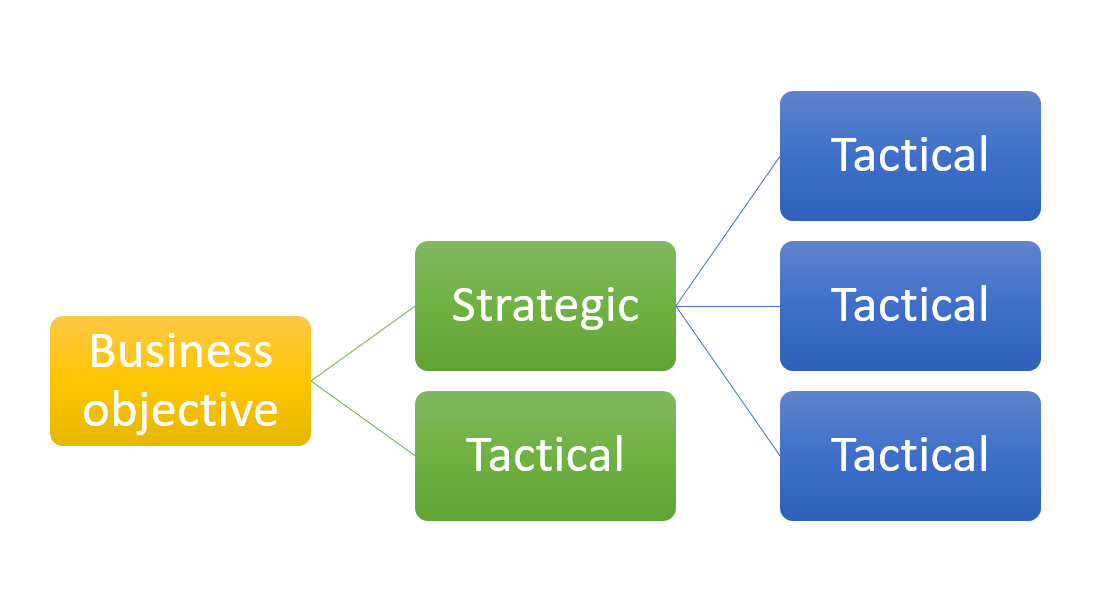
Strategic objectives are long-term goals that provide a vision for how the company wants to achieve success in its given field over the course of one or more years. These goals can provide direction and guide businesses in setting short-term / tactical goals, as well as take decisions regarding investments and resource allocation in order to reach those larger objectives. Examples of strategic objectives include increasing sales revenue, reducing customer churns, reducing costs or improving profitability, or expanding into new markets.
Tactical objectives are shorter-term goals that outline how a company should go about working on one or more initiatives towards achieving their strategic objectives on a day-to-day basis. They often involve specific tasks like tracking customer behavior, developing marketing campaigns, or testing new products and services. Tactical objectives help ensure that businesses stay focused on their larger ambitions / strategic objective even when dealing with more immediate problems like customer service issues or product improvements.
By understanding both strategic and tactical business objectives, businesses can better identify analytical use cases for their data analysis projects. Independent analytics projects can be aligned to the tactical objectives which end up helping achieve strategic objective. Knowing what kind of outcomes they want from the project helps companies narrow down which metrics should be tracked and which areas of data should be looked at first for potential insights that can benefit the organization. This way, businesses can be sure that any data analysis they carry out is helping them take steps towards reaching their overarching visions and long-term success in their chosen field instead of just providing them with random bits of information with little practical value.
One of the key aspect of identifying business objectives is identifying the value metrics / key performance indictors (KPIs) which would help measure the progress and success of initiatives taken towards meeting those business objectives. Some of these metrics / KPIs can be termed as leading KPIs and others can be termed as lagging KPIs. Read one of my related post on KPIs – Leading & Lagging KPIs: Concepts & Examples
To summarize, the first step includes identifying the following:
- What’ the business objective? Whether its strategic or tactical?
- What are the KPIs / value metrics which will be used for measuring the performance of initiatives / projects?
2. Identify Key Business Stakeholders
Identifying key business stakeholders is an essential step in the process of determining the appropriate analytical use cases for any organization. Knowing the stakeholders would help in identifying challenges faced by them (or potential actions they would be taking) and key decisions required to be made by them to take those actions in relation to the business objectives identified in previous step. This would help enable the tailoring of the analytics use cases to meet their objectives and drive desired outcomes. With this knowledge, organizations can better create an environment where data-driven insights are easily understood and implemented. In design thinking paradigm, this is also termed as identifying personas.
It should be noted that the key stakeholders include the following:
- Ones who would be taking decisions and driving actions towards attaining business objectives
- Ones who would be impacted and they can be internal or external customers
The picture below represents the need for identifying the stakeholders early in the game as it would help us identify decisions and later analytical use cases.

Having a clear understanding of which stakeholders need to make what kind of decisions in accordance with their challenges or actions to be taken would determine what type of insights would be required and how it will be used. This would in turn help define the use cases while aligning them with overall organizational goals. This would promote more effective decision making and help setting up data-driven culture. Accurately identifying key stakeholders also allows companies to ensure that they are leveraging their existing customer base (internal or external) when building out their analytics models, as well as proactively addressing potential customer needs before they arise.
Let’s say the business objective is to increase the sales revenue by 30%. The key business stakeholders can be some of the following. They will be those who could take one or more initiatives and execute related projects towards achieving the objective of increasing sales revenue by 30%.
- Chief product officer (CPO): Chief product officer can work with heads of different products to set the objective for product innovation and expansion, which can help to drive increased sales and revenue. This involves identifying market trends, analyzing customer needs and preferences, and developing new products or features that meet those needs and preferences. The Chief Product Officer can also work with the heads of engineering and design to improve existing products, enhance product performance and quality, and reduce costs to increase profitability. The CPO can collaborate with the heads of marketing and sales to develop effective product positioning and messaging, identify new sales channels, and target key customer segments.
- Chief marketing officer (CMO): Chief marketing officer will need to work to create marketing strategy for different products to increase reach their target audience effectively and maximize sales and profitability. This involves conducting market research, identifying customer needs and preferences, developing compelling messaging and creative campaigns, selecting appropriate advertising channels, and continually monitoring and optimizing performance metrics. CMO along with his / her team would require to make decisions related to each of the areas mentioned before. For example, what should be advertising channels, or, what kind of messaging do we have for different market segment? Additionally, the CMO must collaborate closely with other departments such as sales, product development, and customer service to ensure that the marketing strategy aligns with overall business objectives and delivers a consistent, positive customer experience.
- Chief sales officer (CSO): Chief sales officer will need to work on creating sales strategy in order to achieve revenue targets of say 30% additional growth and, in turn, drive business growth. This involves identifying market opportunities, analyzing customer needs and behaviors, developing effective sales processes and methodologies, setting clear performance metrics and goals, and building and managing a high-performing sales team. The Chief Sales Officer must also collaborate closely with other departments such as marketing, product development, and customer service to ensure a unified approach to customer acquisition and retention.
3. Identify Hypotheses: Key Decisions / Actions / Output / KPIs
Identifying key decisions, related actions and output is essential for accurately recognizing analytical use cases. These tuples of decisions – actions – output can be termed as hypothesis. Each of the hypotheses will require to be tested for the org wide adoption. A/B testing will prove to be helpful in achieving this goal. One of the most important tool that will help in identifying these hypotheses will be asking questions.
Given the example that we are working such as increasing sales revenue by 30%, chief sales officer can start asking some of the following questions to identify decisions – actions – output hypotheses:
- What were our sales revenue growth rates for the same period in the previous year?
- Which customer segments have contributed the most to our revenue in the current year?
- Which products or services have contributed the most to our revenue in the current year?
- Are there any gaps or inefficiencies in our sales processes or strategies that could be addressed to improve performance?
- Do we have the right people and resources in place to achieve our revenue growth target?
- How do we differentiate ourselves from our competitors to win more business?
- Who are our most profitable customer segments, and how can we target them more effectively?
- Are we collaborating more effectively with other departments such as marketing and product development to drive revenue growth?
- Have we leveraged any new technologies or tools to streamline our sales processes or improve our sales performance?
From the above questions, we can perform exploratory data analysis and arrive at decision – action – output hypotheses. Let’s understand with few examples:
- Question: What were our sales revenue growth rates for the same period in the previous year?
- Decisions: Analyzing this question can result in the decisions such as some of the following:
- Set the realistic growth revenue growth targets for the current year although the sales objective is set to 30% increased revenue.
- Review the performance metrics of individual sales reps, sales territories, and sales channels and identify areas of improvement and resources allocation.
- Decide on custom sales strategies based on the comparison of previous year’s sales revenue growth rates and assessing whether there have been any significant changes in market trends
- Create a forecast of the sales revenue for the current year and make decisions on how to allocate resources and optimize sales processes to achieve the forecasted revenue. Decide to leverage AI based solution as appropriate.
- Actions: Each of the above decisions can result in one or more actions. And, different actions can have different impacts. Lets understand different actions that can result from the decision – “Decide on the areas of improvement and resources allocation by reviewing the performance metrics of individual sales reps, sales territories, and sales channels“
- Reassign sales territories to balance workload and maximize efficiency.
- Allocate more resources to high-performing sales channels or territories.
- Adjust compensation or incentives to motivate sales reps and encourage better performance.
- Provide additional training or coaching to individual sales reps who are underperforming.
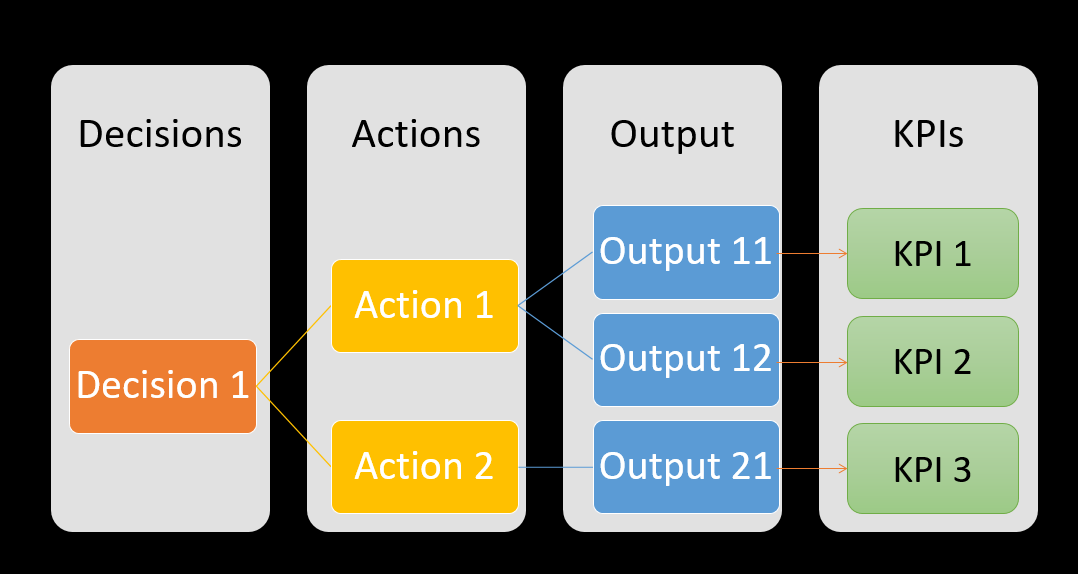
As shown above, the decisions are those which will be required to be made by the stakeholders identified in the previous step. Decisions can also be termed as levers. Decisions will result actions-output pairs. Actions taken as a result of a particular decision can result in multiple different outputs / consequences which can impact another set of stakeholders (customers). Actions can also be termed as levers. Each of this output / consequences would need to be measured using KPIs. These KPIs can also be termed as leading KPIs. And, each of the output would need to be mapped to final outcome and the KPIs (termed as value metrics or lagging KPIs). The following picture represents the relationship between decisions – actions – output – KPIs.
The set of decision – actions – output can also be termed as the hypothesis as there is a level of uncertainty whether the decision and resulting actions will result in desired output which would help in achieving the desired outcome. One or more hypothesis would need to be tested while deploying the solution in production as part of experimental design approach. A/B testing can prove to be immensely helpful. Stakeholders or key decision makers come together to agree upon a set of decisions. Out of multiple action-output pair, one would require to decide upon selected few actions.
Analytics use cases can be used to uncover valuable insights and answer important questions such as “how did this particular decision lead us to this outcome?” or “what are the most effective ways of achieving our goals?”. They also allow us to identify potential bottlenecks in our systems, optimize processes and increase efficiency. With a clear understanding of key decisions, related actions and their outputs, it becomes much easier for organizations to gain valuable insight into their operations and make better informed decisions.
Having a thorough understanding of all the relevant components such as decisions, actions, output and KPIs is beneficial for identifying most appropriate analytics use cases. With all the necessary pieces in place, organizations can more accurately measure different initiatives and decisions associated with them.
4. Identify Analytics Use Cases & KPIs / Metrics
One or more similar decisions, actions and output can be grouped together to form different analytical use cases. The idea is to aggregate decisions into a cluster of decisions around a common subject area that have measurable financial impact. This cluster of decisions can be labelled as the use case. We, thus, arrive to so-called analytical use cases. Each of these analytical use cases would be tied to the business objectives just to make sure that we are always aligned with so-what when we are working on each of these use cases.
Let’s understand with the example of sales objective of increasing sales by 30% that we have been working in this post:
- Question: What were our sales revenue growth rates for the same period in the previous year?
- Decision: Review the performance metrics of individual sales reps, sales territories, and sales channels and identify areas of improvement and resources allocation.
- Actions: Following are some of the actions which can result from the above decision. These actions are hypothesized to have positive impact on sales growth.
- Reassign sales territories to balance workload and maximize efficiency.
- Allocate more resources to high-performing sales channels or territories.
- Adjust compensation or incentives to motivate sales reps and encourage better performance.
- Provide additional training or coaching to individual sales reps who are underperforming.
- Analytics use case: We have got a hypothesis in place that taking above decision and related actions can aid in achieving the objective of increased sales growth by 30%. The following can be analytics use case:
- Create a dashboard that tracks sales revenue (lagging KPI) for current and past 4-5 years. Along with that, it must track KPIs in order to support the hypothesis that the actions will aid in enhanced sales growth. The following can be some of the KPIs:
- Sales territories vis-a-vis sales growth and related sales teams
- Sales by individual sales team vs sales resources
- Incentives vis-a-vis sales teams
- Training KPIs for sales team
- Create a dashboard that tracks sales revenue (lagging KPI) for current and past 4-5 years. Along with that, it must track KPIs in order to support the hypothesis that the actions will aid in enhanced sales growth. The following can be some of the KPIs:
- Hypothesis tests: Analytical use cases will be executed to validate the hypotheses related to decisions – actions – outcome. Thus, in the current example, dashboard (analytics use case) will be used to validate the decision and actions as mentioned in this section.
5. Prioritize Use Cases
Prioritizing use cases is essential for achieving desired outcomes with analytical use cases. Doing so helps organizations align their strategy with the capabilities of their available resources, as well as to measure the relative impact and feasibility of each case against their objectives. Through proper prioritization, organizations can better understand which use cases will provide the most value to their business in the short-term, while also being mindful of the long-term implications and benefits that each case may have.
The Prioritization Matrix process provides an effective framework to help ensure that stakeholders are able to collectively make informed decisions about which use cases should be given priority over others. This process enables teams to systematically evaluate each use case objectively and make reasoned decisions based on a variety of criteria, such as value to the business, level of risk involved, timelines for implementation, and resource requirements. The matrix then helps prioritize those use cases based on those criteria, highlighting which ones should be given more emphasis or focus compared to others. The following is a sample prioritization matrix with letters representing the use case.
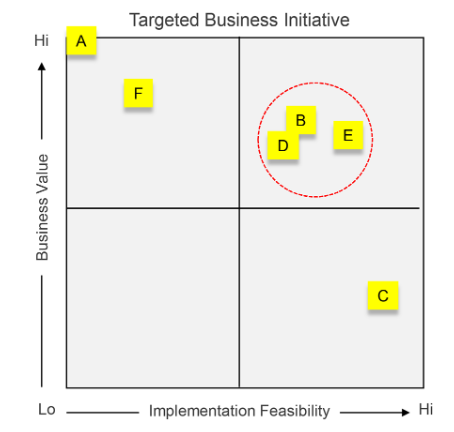
The following are some of key points about the prioritization matrix:
- The prioritization matrix weighs the “value” (financial, customer, operational, and environmental) of different use case against the implementation feasibility (data, architecture, technology, skills, timeframe, and management support) of those same use cases over the next 12 to 18 months.
- The prioritization matrix process gives a fair playground for discussions on the value of the use case against its implementation feasibility.
Using a prioritization matrix also helps ensure that no one stakeholder can unilaterally influence decisions regarding which use cases should be given priority; instead it allows all stakeholders to work together and reach consensus through an objective assessment of each use case’s relative merits. This helps foster alignment between different stakeholders and build confidence in the decisions being made by giving everyone a say in how resources are allocated towards certain projects or initiatives.
6. Identify / Create Analytical Solution Design
Identifying analytical solutions is extremely important for analytical use cases. Knowing what analytics are needed to support and answer questions related to the use case helps guide decision-makers in the right direction. It can also help them better understand the data, spot trends, and draw insights from it. Descriptive analytics provide a snapshot of what is happening in a business at present, predictive analytics provide insight into what might happen in future, and prescriptive analytics recommend best courses of action based on current data and trends.
Using these three types of analytics allows businesses to gain a better understanding of their decisions and their impact. Descriptive analytics help to track the KPIs related to actions taken and in turn take different decisions if required. Predictive analytics focus on using historical data to make predictions in case there is uncertainty about the action to be taken. The related KPIs can be tracked on dashboard to validate the effectiveness of the decisions being made based on the predictions and whether one continues to rely on the predictions or choose different predictive models. Prescriptive analytics would result in optimizing the outcome made by the decisions.
7. Identify data sources
Identifying data sources is a critical component of any analytical use case. By understanding the data points available, an organization can better understand the trends and patterns that are driving their business decisions. By using insights from data, businesses can make informed decisions to maximize profitability and minimize risk. Data sources play a fundamental role in all form of analytics use cases including those related to descriptive, predictive and prescriptive analytics.
For every use case, you would need to ask the following question to avoid data bias.
What data do we have (residing in the internal data sources) and what data would we need to collect from external resources to extract the desired insights?
8. Identify Technology & Related Architecture
It is important to identify the right technology and solution architecture for implementing analytical use cases. And, this would require solution and technology architecture for end-to-end solution including system serving predictions, MLOps, feature generation system, etc. Proper selection of the technology stack, platform architecture, and data solution design can be critical for successful implementation and deployment of use cases.
When implementing and deploying predictive models in production, it is important to carefully design the technology and solution architecture. This architecture should be designed to support data collection and feature engineering in order to build and deploy high-performance models that can stay up-to-date with changing conditions. It should also be capable of handling large volumes of data while providing real-time performance when needed. The technology architecture must ensure that any predictive models deployed in a production environment are secure, reliable, and monitorable so that they can continually feed accurate insights back into the business decision making process. All of these factors contribute to a successful implementation and deployment of predictive models in production.
Dashboards are an essential tool for visualizing data and providing business insights. When designing the technology and solution architecture for implementing and deploying dashboards, it is important to consider factors such as flexibility, scalability, and security. Flexibility is essential for ensuring that users of different roles can access the right data at the right time. It is also important to account for scalability so that more data can be handled when needed. Finally, a secure architecture must be implemented in order to ensure that all user data is protected from malicious threats.
9. Implement Analytical Solutions
The implementation of analytical use cases is an important factor in ensuring that these use cases yield the desired results. All analytical projects are built on the same foundation, consisting of data integration, data modeling, and analytics. Data integration involves connecting different sources of data into a single source for analysis. This could include extracting data from multiple databases, flat files, and other sources. The data must be cleansed and standardized to ensure accuracy and integrity during the subsequent phases. Data modeling involves transforming raw data into meaningful formats that can be used to analyze trends or predict future outcomes. Modeling is typically done using statistical methods such as linear regression, logistic regression, decision trees, neural networks, and more. Finally, analytics refers to the process of discovering patterns and relationships in the data collected through predictive models or descriptive techniques such as clustering or segmentation.
Analytical use cases require careful consideration when designing and implementing their solutions. It is important to carefully identify all relevant stakeholders involved in the process in order to understand both their needs as well as any areas where there may be potential conflicts in how they expect their data to be used. Additionally, it is important to understand all aspects related to security including access control mechanisms for who will have access to which parts of the system and what level of authorization will be required for each user type.
Once a plan has been established for how the analytical use case should work, it is then time for implementation. This stage involves setting up appropriate software solutions and hardware infrastructure necessary for gathering and storing relevant information from various sources along with developing algorithms that can perform desired analysis on this collected information. Business intelligence tools such as Tableau or QlikView can also be employed here if needed depending on project requirements. Additionally, machine learning methods may need to be applied depending on what type of analysis needs to be performed on gathered information and whether it requires predictions or not (e.g., supervised vs unsupervised learning).
10. Create Experimental Design & Deploy
Experimental design is a popular method of deploying analytical solutions that can maximize the effectiveness of data-driven decisions. This approach is often characterized by multiple trials or experiments conducted in order to identify the most effective combination of factors, inputs, and variables within a system. In this way, experimental design can be used to test the most efficient methods for implementing new or existing analytical solutions.
The primary benefit of experimental design allows decision makers to deploy solutions based on what-if scenarios representing different experiments and gathering evidences to decide on which solution should be considered for final deployments. At its core, experimental design seeks to balance two opposing forces – exploration and exploitation. Exploitation involves working with existing systems and making slight adjustments in order to increase efficiency; while exploration consists in introducing completely new elements that could potentially bring new opportunities. With analytical solutions deployment, both kind of techniques such as exploration and exploitation would need to be followed. While existing solutions would need to be tweaked (re-training models with new data), new solutions (new models trained) would also need to be developed and deployed from time to time.
Conclusion
In conclusion, these are the steps to take when you want to go from business problem to analytics use cases. First, you need to identify your business objectives and stakeholders. Then, identify the decisions, actions, and outcomes that can be impacted with insights. After that, identify different types of use cases and prioritize them according to value. After that, it’s time to start thinking about technology and architecture solutions. Finally, implement your use cases one by one and deploy them into production. If this process seems overwhelming or you would like more information on any of these steps, please reach out via the contact form on my website or leave a comment below. I’m always happy to help where I can!
Check out the blog summarized in form of presentation slides!

Check out my latest book titled as First Principles Thinking: Building winning products using first principles thinking.
- Mathematics Topics for Machine Learning Beginners - July 6, 2025
- Questions to Ask When Thinking Like a Product Leader - July 3, 2025
- Three Approaches to Creating AI Agents: Code Examples - June 27, 2025
I found it very helpful. However the differences are not too understandable for me