Data analytics has become a buzzword in the business world today, and for all good reasons indeed as it brings competitive advantage to the business if leveraged in the most appropriate manner. The ability to collect, process, and analyze large amounts of data in order to solve business problems has given organizations unprecedented insights into their operations, customers, and markets. By leveraging these insights, businesses can make informed decisions also called as data-driven decisions, identify new opportunities, and drive growth.
But what exactly is data analytics? What are the different forms of data analytics? Why is it so important? And how can businesses leverage it to their advantage? How can you get your career kickstarted in the data analytics? In this blog, we’ll answer all these questions and more. We’ll explore the basics of data analytics, its benefits, and how it can be applied in various industries. Whether you’re new to data analytics or looking to deepen your knowledge, this blog will provide you with a solid foundation to help you make the most of your data. So, let’s dive in and explore the world of data analytics!
What is Data Analytics?
Data analytics can be defined as a set of methods, tools & technologies that are used to analyze the problem in hand and find most appropriate solutions by leveraging data while applying different analytical methods. The solutions primarily revolve around extracting actionable insights from the data that drive key business decisions related to problem in hand, which, then, result in the desired business outcomes. These methods belong to different forms of analytics including descriptive, diagnostic, predictive and prescriptive. To make effective use of data analytics, businesses must ensure the quality of their data through appropriate data management and governance methods, tools & technologies.
In the business world, data analytics is used to optimize various aspects of operations, such as marketing, supply chain management, and customer service. For example, a retail company can use data analytics to understand consumer buying patterns, identify the most popular products, and forecast demand. This information can be used to optimize inventory management, reduce waste, and improve customer satisfaction.
In finance, data analytics is crucial for risk management and investment decisions. Banks and financial institutions use data analytics to analyze credit risk, detect fraud, and monitor market trends. For example, a bank can use data analytics to analyze customer behavior, identify potential fraudulent activities, and mitigate risks.
In healthcare, data analytics is used to improve patient outcomes and reduce costs. Healthcare providers use data analytics to analyze patient data, identify patterns, and make informed decisions about treatment plans. For example, a hospital can use data analytics to track patient outcomes, identify areas for improvement, and optimize resource allocation.
As a matter of fact, data analytics can be applied in various different fields and help stakeholders with actionable insights which can lead to desired business outcomes.
Different forms of Data Analytics
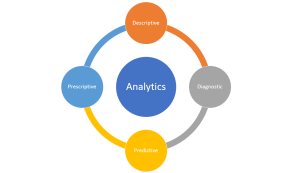
The following are different forms of analytics which can be used to solve different kinds of business problems:

Descriptive Analytics
Descriptive analytics refers to the analysis of historical data to provide insights on what happened in the past, driven by one or more decisions. In addition, descriptive analytics is also used to analyze what is happening (output of activities) in the current times as a result of one or more business decisions being taken. In a way, descriptive analytics can be used to validate the hypothesis around insights – decisions – action – outcome. Descriptive analytics can be used to validate your hypothesis around the decisions taken in past or present based on KPIs tracked on dashboards.
It is the most basic form of analytics and involves summarizing and visualizing data to identify patterns and trends. An example of descriptive analytics is a sales KPIs that summarizes the sales for a specific period, such as monthly or quarterly. In addition, the dashboard can be used to assess the activities / action output with the help of related KPIs (called as leading KPIs). This type of analytics can as well provide insights (also called lagging KPIs) into which products are selling the most, which customers are the most profitable, and which regions are generating the most revenue. By using descriptive analytics, businesses can identify areas where they are performing well and where they need to improve.
Diagnostic Analytics
Diagnostic analytics involves analyzing data to understand why something happened in the past or why something is happening in present times. It is used to investigate the causes of a particular event or trend and is often used in conjunction with descriptive analytics. For example, if a company notices a decline in sales, they may use diagnostic analytics to identify the factors that contributed to the decline, such as changes in consumer behavior or increased competition. By using diagnostic analytics, businesses can gain a deeper understanding of the root causes of problems and take action to address them.
Statistics plays a crucial role in diagnostic analytics, as it provides tools to identify the causes of a particular event or trend. Hypothesis testing, which is a statistical method, plays a key role in understanding the association between dependent and independent variables. To do this, analysts typically start with descriptive analytics, which involves summarizing and visualizing data to identify patterns and trends. Once patterns and trends have been identified, analysts may use statistical methods to test hypotheses about the causes of those patterns and trends.
Hypothesis testing is a statistical method that involves testing a hypothesis about a population using sample data. It helps to determine whether a particular relationship or pattern is statistically significant, or whether it could have occurred by chance. By testing hypotheses, analysts can identify which variables are most strongly associated with the outcome they are trying to explain.
Lets understand the concepts of diagnostic analytics with an example. Lets say, suppose a company has noticed a decline in sales over the past few months and wants to understand why. One possible explanation is that a new competitor has entered the market and is taking market share. To test this hypothesis, analysts could compare sales data before and after the competitor entered the market, and use statistical methods to determine whether the decline in sales is statistically significant.
As illustrated in the above example, hypothesis testing provides a framework for understanding the association between dependent and independent variables, and helps to identify the most likely causes of a particular trend or event.
Predictive Analytics
Predictive analytics involves using statistical models and machine learning algorithms to analyze historical data and predict future outcomes. It is used to forecast trends and identify patterns that may not be apparent through descriptive or diagnostic analytics. For example, a company may use predictive analytics to forecast future sales based on historical sales data and other factors such as economic indicators and consumer trends. By using predictive analytics, businesses can anticipate future trends and take proactive measures to capitalize on opportunities or mitigate risks.
Here are some examples of real world problems and how they can be dealt with different kinds of machine learning algorithms:
- Regression Algorithm (Sales Forecasting): Sales forecasting is a common business problem that can be solved using predictive analytics. By analyzing historical sales data and other relevant factors such as seasonality, economic indicators, and consumer trends, businesses can forecast future sales with reasonable accuracy. Regression algorithms such as linear regression, decision tree regression, or random forest regression can be used to develop models for sales forecasting.
- Classification Algorithm (Customer Churn Prediction): Customer churn is a critical issue for businesses as it can impact revenue and profitability. By using predictive analytics, businesses can identify customers who are likely to churn and take proactive measures to retain them. Classification algorithms such as logistic regression, decision tree, or support vector machine can be used to develop models for predicting customer churn.
- Clustering Algorithm (Customer Segmentation): Customer segmentation is a valuable tool for businesses as it helps to identify different customer groups with distinct needs and behaviors. By using clustering algorithms such as K-means, hierarchical clustering, or DBSCAN, businesses can segment their customers based on various criteria such as demographics, behavior, or purchasing patterns. This information can be used to personalize marketing efforts and improve customer engagement.
- Image Classification using CNN (Quality Control): Quality control is a critical issue in manufacturing and production, and businesses can use predictive analytics to identify defects or anomalies in the production process. By using convolutional neural networks (CNN), businesses can analyze images of products or production lines and identify defects such as cracks, discoloration, or other abnormalities.
- Generative AI such as Transformers for Text Generation (ChatGPT): ChatGPT is a classic example of generative AI language model developed by OpenAI that can understand natural language and generate human-like responses. It is based on the GPT-3.5 / GPT-4.0 architecture and has been trained on a massive amount of data, allowing it to generate high-quality responses to a wide range of questions and prompts. ChatGPT is helping people become more predictive in a couple of ways. Firstly, it can be used as a tool for generating insights from large amounts of unstructured data, such as social media posts, customer feedback, or online reviews. By feeding this data to ChatGPT, businesses can generate summaries, sentiment analysis, and other insights that can help them make informed decisions and predict trends.
Prescriptive Analytics
Prescriptive analytics involves using data and analytics to provide recommendations on what actions to take to achieve a desired outcome. It uses a combination of descriptive, diagnostic, and predictive analytics to provide insights and recommendations. For example, a healthcare provider may use prescriptive analytics to recommend a treatment plan for a patient based on their medical history, symptoms, and other factors. By using prescriptive analytics, businesses can make data-driven decisions and take actions that are most likely to achieve their desired outcomes.
Optimization-based solutions are a common approach used in prescriptive analytics, where the goal is to identify the best course of action to achieve a desired outcome. Optimization models are used to identify the optimal values of decision variables that will maximize or minimize a particular objective function while satisfying a set of constraints.
A real-world example of optimization-based solutions in prescriptive analytics is production planning in manufacturing. In this case, the goal is to determine the optimal production plan that minimizes costs while meeting customer demand and other constraints such as resource availability, labor capacity, and production capacity.
To solve this problem, an optimization model can be developed that considers various factors such as demand, inventory levels, production costs, and capacity constraints. The model can be formulated as a linear programming problem, where the decision variables are the production quantities for each product and the objective function is the total production cost. The constraints include customer demand, inventory levels, and capacity constraints.
By solving this optimization problem, businesses can identify the optimal production plan that minimizes costs while meeting customer demand and other constraints. This information can be used to drive actions such as adjusting production levels, reallocating resources, or changing the production schedule.
Different workstreams in Data Management / Governance
When talking about data analytics, data management and data governance requires the utmost attention, as they ensure the accuracy, integrity, and security of data. Analytics can be as good as the data used for analysis. Here are some of the most common workstreams in data management and data governance:
- Data Quality Management: Data quality management involves establishing standards and processes for ensuring that data is accurate, complete, and consistent. It includes activities such as data profiling, data cleansing, and data enrichment. Good data quality is essential for accurate and reliable data analysis, as it ensures that insights are based on trustworthy data.
- Metadata Management: Metadata management involves documenting and managing the information about data, including its structure, relationships, and usage. It is critical for understanding the context and meaning of data, which is necessary for effective data analysis.
- Data Security Management: Data security management involves ensuring that data is protected from unauthorized access, use, or disclosure. This includes establishing security policies and procedures, managing access controls, and monitoring for security breaches. Data security is essential for maintaining the confidentiality, integrity, and availability of data, which is critical for effective data analytics.
- Master Data Management: Master data management involves creating and managing a single, consistent view of key data elements across an organization. It includes activities such as data modeling, data integration, and data quality management. Master data management is key to data analytics, as it ensures that data is consistent and accurate across different systems, enabling better decision-making.
- Data Governance: Data governance involves establishing policies, standards, and processes for managing data across an organization. It includes activities such as data stewardship, data lineage, and data quality management. Data governance is essential for ensuring that data is managed effectively and efficiently, enabling better data analytics.
Different Career Options in Data Analytics
Here are some of the most popular career options in the field of data analytics, along with a brief definition of each:
- Data Analyst: A data analyst is responsible for collecting, processing, and performing statistical analyses on large datasets to identify patterns, trends, and insights that can inform business decisions.
- Data Scientist: A data scientist is responsible for designing and developing statistical models, machine learning algorithms, and other analytical tools to extract insights from data and solve complex business problems.
- Statistician: A statistician is responsible for developing statistical models and analyzing data to identify patterns, trends, and relationships that can inform business decisions.
- Data Stewards: A data steward is responsible for ensuring the quality, accuracy, and integrity of data by developing and implementing data management processes and policies.
- Data Lineage Experts: A data lineage expert is responsible for tracing the origin and movement of data across various systems and processes to ensure data accuracy and compliance with regulations.
- Data Governance Professionals: A data governance professional is responsible for developing and implementing policies and procedures for managing data across an organization, ensuring data quality, and protecting sensitive data.
- Data Engineer: A data engineer is responsible for designing and developing the systems and infrastructure needed to store, process, and analyze large amounts of data.
Conclusion
Data analytics is a rapidly growing field that has become increasingly important for businesses and organizations of all sizes. From descriptive analytics to predictive analytics and beyond, there are many different forms of data analysis that can help organizations to gain insights into their data and make better decisions. However, to effectively utilize these analytics, it’s important to have strong data management and governance practices in place. For those interested in pursuing a career in data analytics, there are a variety of options available, including data analyst, data scientist, business analyst, and more. Each of these roles requires a unique set of skills and expertise, but all offer the opportunity to work with data and make a significant impact on an organization.
If you are interested in learning more about data analytics or pursuing a career in this field, I encourage you to reach out and explore your options. Whether you want to learn more about the different types of analytics or need advice on how to get started in your career, there are many resources available to help you. So, don’t be afraid to ask questions and seek out guidance as you navigate this exciting and rewarding field. Please share your feedback on this blog, and if you have any questions, feel free to reach out.

Check out my latest book titled as First Principles Thinking: Building winning products using first principles thinking.
- Mathematics Topics for Machine Learning Beginners - July 6, 2025
- Questions to Ask When Thinking Like a Product Leader - July 3, 2025
- Three Approaches to Creating AI Agents: Code Examples - June 27, 2025
I found it very helpful. However the differences are not too understandable for me