Category Archives: Data Science
Ridge Classification Concepts & Python Examples

In machine learning, ridge classification is a technique used to analyze linear discriminant models. It is a form of regularization that penalizes model coefficients to prevent overfitting. Overfitting is a common issue in machine learning that occurs when a model is too complex and captures noise in the data instead of the underlying signal. This can lead to poor generalization performance on new data. Ridge classification addresses this problem by adding a penalty term to the cost function that discourage complexity. This results in a model that is better able to generalize to new data. In this post, you will learn about Ridge classifier in detail with the help of …
Pandas Dataframe loc, iloc & brackets examples
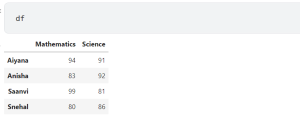
Pandas is a powerful data analysis tool in Python that can be used for tasks such as data cleaning, exploratory data analysis, feature engineering, and predictive modeling. In this article, we will focus on how to use Pandas’ loc and iloc functions on Dataframe, as well as brackets with Dataframe, with examples. As a data scientist or data analyst, it is very important to understand how these functions work and when to use them. In this post, we will work with the following Pandas data frame. Use loc and iloc functions to get Rows of Dataframe The loc function is used to get a particular row in a Dataframe by …
Pandas: How to Create a Dataframe – Examples
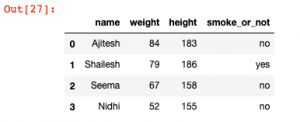
One of the most popular modules for working with data in Python is the Pandas library. Pandas provides data structures and operations for working with structured data. A key concept in Pandas is the Dataframe. Learning how to create and use dataframes is an important skill for anyone including data analysts and data scientists working with data in Python. In this post, you will learn about how to create a Pandas dataframe with some sample data. What is Pandas Dataframe? A Pandas dataframe is a two-dimensional data structure, like a table in a spreadsheet, with columns of data and rows of data. Dataframe is analogous to a table in SQL …
Central Limit Theorem: Concepts & Examples
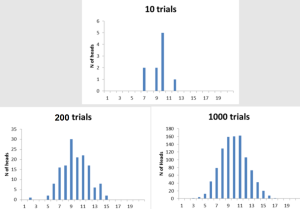
The central limit theorem is one of the most important concepts in statistics. This theorem states that, given a large enough sample size, the distribution of sample averages will be approximately normal. This is a huge deal because it means that we can use the normal distribution to make predictions about populations based on samples. In this article, we’ll explore the central limit theorem in more detail and look at some examples of how it works. As data scientists, it is important to understand the central limit theorem so that we can apply it to real-world situations. What is the central limit theorem and why is it important? The central …
Probability concepts, formulas & real-world examples

Probability is a branch of mathematics that deals with the likelihood of an event occurring. It is important to understand probability concepts if you want to get good at data science and machine learning. In this blog post, we will discuss the basic concepts of probability and provide examples to help you understand it better. We will also introduce some common formulas associated with probability. So, let’s get started! What is probability and what are the different types? Probability is a concept in mathematics that measures the likelihood of an event occurring. It is typically expressed as a number between 0 and 1, with 0 indicating that an event is …
Statistics – Random Variables, Types & Python Examples
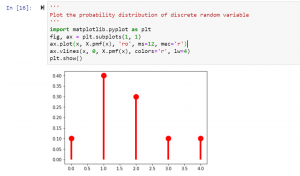
Random variables are one of the most important concepts in statistics. In this blog post, we will discuss what they are, their different types, and how they are related to the probability distribution. We will also provide examples so that you can better understand this concept. As a data scientist, it is of utmost importance that you have a strong understanding of random variables and how to work with them. What is a random variable and what are some examples? A random variable is a variable that can take on random values. The key difference between a variable and a random variable is that the value of the random variable …
How to Create Pandas Dataframe from Numpy Array
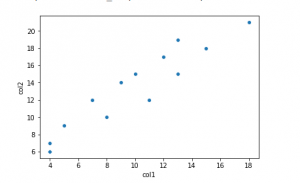
Pandas is a library for data analysis in Python. It offers a wide range of features, including working with missing data, handling time series data, and reading and writing data in different formats. Pandas also provides an efficient way to manipulate and calculate data. One of its key features is the Pandas DataFrame, which is a two-dimensional array with labeled rows and columns. A DataFrame is a table-like structure that contains columns and rows of data. Creating a Pandas DataFrame from a NumPy array is simple. In this post, you will get a code sample for creating a Pandas Dataframe using a Numpy array with Python programming. Step 1: Load …
Machine Learning Sklearn Pipeline – Python Example
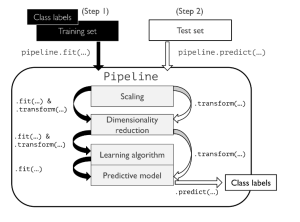
In this post, you will learning about concepts about machine learning (ML) pipeline and how to build ML pipeline using Python Sklearn Pipeline (sklearn.pipeline) package. Getting to know how to use Sklearn.pipeline effectively for training/testing machine learning models will help automate various different activities such as feature scaling, feature selection / extraction and training/testing the models. It is recommended for data scientists (Python) to get a good understanding of Sklearn.pipeline. Introduction to Machine Learning Pipeline & Sklearn.pipeline Machine Learning (ML) pipeline, theoretically, represents different steps including data transformation and prediction through which data passes. The outcome of the pipeline is the trained model which can be used for making the predictions. …
Sequence Models Quiz 1 – Test Your Understanding

Sequence modeling is extremely important for data scientists as it can be used in a variety of real-world applications. Sequence modeling is used in speech recognition, image recognition, machine translation, and text summarization. These are all important applications that data scientists must be familiar with. As a data scientist, it is important to have a good understanding of sequence modeling and how it can be used to solve real-world problems. In this blog, we’ll be looking at a quiz around sequence models, more specifically the different types of sequence models. This will help us understand how sequence models work and can be used in an interview situation. Before getting into …
Performance metrics for Time-series Forecasting models
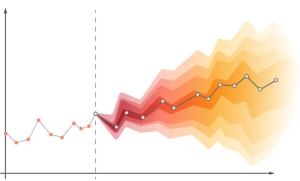
Time-series forecasting is a specific type of forecasting / predictive modeling that uses historical data to predict future trends in a particular time series. There are several different metrics that can be used to measure the accuracy and efficacy of a time-series forecasting model, including Mean Absolute Error (MAE), Root Mean Squared Error (RMSE), and others. By understanding these performance metrics, you can better assess the effectiveness of your time-series forecasting model and make necessary adjustments as needed. In this blog, you will learn about the different time-series forecasting model performance metrics and how to use them for model evaluation. Check out a related post – Different types of time-series …
Sample Dataset for Regression & Classification: Python
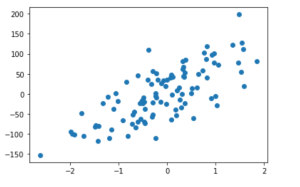
A lot of beginners in the field of data science / machine learning are intimidated by the prospect of doing data analysis and building regression (linear) & classification models in Python. But with an ability to create sample dataset using Python packages, you can practice your skills and build your confidence over a period of time. The technique demonstrated in this blog post to create and visualize / plot the sample dataset includes datasets that can be used for regression models such as linear regression and classification models such as logistic regression, random forest, SVM etc. You can use this technique to explore different methods for solving the same problem. …
Ranking Algorithms & Types: Concepts & Examples
Ranking algorithms are used to rank items in a dataset according to some criterion. Ranking algorithms can be divided into two categories: deterministic and probabilistic. Ranking algorithms are used in search engines to rank webpages according to their relevance to a user’s search query. In this article, we will discuss the different types of ranking algorithms and give examples of each type. What is a Ranking Algorithm? A ranking algorithm is a procedure that ranks items in a dataset according to some criterion. Ranking algorithms are used in many different applications, such as web search, recommender systems, and machine learning. A ranking algorithm is a procedure used to rank items …
Knowledge Graph Concepts & Machine Learning: Examples
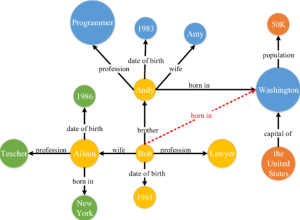
Knowledge graphs and machine learning are two important tools for understanding and making decisions in business. Knowledge graphs can be used to understand and model complex concepts, while machine learning is a process by which computers learn from data, without being explicitly programmed. Together, these two tools can be used to make better decisions in business by understanding the relationships between data points. In this blog, you will learn about the basics of knowledge graphs and machine learning, and how they can be used to improve decision making in business. What is a Knowledge Graph & how they can are used? A knowledge graph is a collection of data that …
AI / Machine learning (ML) Model Governance Framework

AI / Machine learning (ML) based solutions / applications have become increasingly important in business and industry. However, with the power to make decisions that can impact people’s lives comes a responsibility to use those tools ethically and responsibly. The machine learning model governance framework is designed to help businesses do just that. In this blog, you will learn about the AI / Machine Learning Model Governance framework, its benefits, and how you can implement it in your organization. What is AI / Machine learning (ML) model governance and why its important? Machine learning model governance is a set of process and related tools & frameworks that the businesses need …
Data Lake: Design principles & Best practices
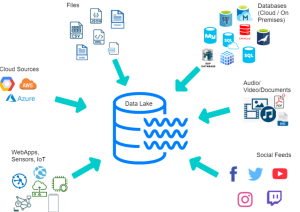
In today’s business world, data is king. The more data you have, the more insights you can glean about your customers, your products, and your operations. And the best way to collect and store all that data is in a data lake. A data lake is a data management and analytics platform that offers several benefits over traditional data warehouses. Data lakes have gained in popularity in recent years due to the growing volume of data being generated by businesses and organizations of all sizes. But before you can reap the benefits of a data lake, you need to design it correctly. The people who should be involved in designing …
Targeted Advertising & Machine Learning: Examples

Targeted advertising is nothing new. Businesses have been using targeted ads for years in order to try and increase sales. However, with the advent of machine learning, businesses are now able to target their ads more effectively than ever before. The importance of using machine learning for targeted advertising cannot be overstated. By using machine learning, businesses can target their ads more accurately and thus see a higher return on investment. This is because machine learning can take into account a variety of factors that humans would not be able to consider, such as browsing history and purchase history. As a business, it is important to stay ahead of the …

I found it very helpful. However the differences are not too understandable for me