Knowledge graphs and machine learning are two important tools for understanding and making decisions in business. Knowledge graphs can be used to understand and model complex concepts, while machine learning is a process by which computers learn from data, without being explicitly programmed. Together, these two tools can be used to make better decisions in business by understanding the relationships between data points. In this blog, you will learn about the basics of knowledge graphs and machine learning, and how they can be used to improve decision making in business.
What is a Knowledge Graph & how they can are used?
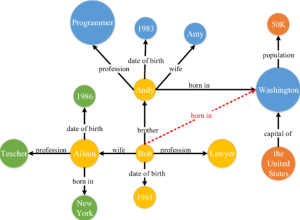
A knowledge graph is a collection of data that can be used to understand and model complex concepts. Knowledge graphs can be used to understand the relationships between data points, and to make better decisions in business by understanding the complex concepts involved. The structure of a knowledge graph can be described using nodes and edges. A node is a point in the graph, and an edge is a connection between two nodes. The following is a picture of a sample knowledge graph depicting how relationship is captured with knowledge graph.

Some examples of knowledge graphs include the following:
- A social network graph, which shows the relationships between people on a social networking site. An example of a social networking graph would be a graph that shows the relationships between people on Facebook. Nodes would represent individual people, and edges would represent the relationships between them (e.g., friendship, marriage, or co-workers). This type of graph can be used to understand the complex social dynamics at play on Facebook, and to make better decisions about how to market to different groups of people.
- A food web, which shows the relationships between different species of animals and plants in a given ecosystem. Nodes would represent different species of animals and plants, and edges would represent the relationships between them (e.g., predator-prey, or plant-pollinator). This type of graph can be used to understand the complex food web at play in an ecosystem, and to make better decisions about how to protect or manage that ecosystem.
- A corporate structure, which shows the relationships between different departments and employees in a company. Describe an example of knowledge graph using corporate structure graph including nodes & edgesAn example of a corporate structure graph would be a graph that shows the relationships between different departments and employees in a company. Nodes would represent different departments, and edges would represent the relationships between them (e.g., supervisor-subordinate, or department-employee). This type of graph can be used to understand the complex corporate structure at play in a company, and to make better decisions about how to organize and manage that company.
- An example of a knowledge graph from finance would be a graph that shows the relationships between different types of investments (e.g., stocks, bonds, commodities, etc.). Nodes would represent different types of investments, and edges would represent the relationships between them (e.g., investment type A is more risky than investment type B). This type of graph can be used to understand the complex financial landscape, and to make better decisions about where to invest money.
- An example of a knowledge graph from healthcare would be a graph that shows the relationships between different diseases (e.g., cancer, heart disease, etc.). Nodes would represent different diseases, and edges would represent the relationships between them (e.g., a disease can cause another disease). This type of graph can be used to understand the complex relationship between diseases, and to make better decisions about how to treat and prevent them.
Knowledge graphs can be used in a variety of ways in the real world. Perhaps one of the most obvious applications is in understanding customer relationships. A company can use a knowledge graph to understand how customers are related to each other, and what products they are likely to buy together. This can help businesses create more effective marketing campaigns and target their advertising efforts more accurately.
Knowledge graphs can also be used for product design and development. By understanding the relationships between different products, a company can create new products that are likely to be successful based on what is already popular. Additionally, knowledge graphs can help companies improve their customer service by identifying common customer problems and addressing them quickly.
Ultimately, knowledge graphs are a powerful tool for understanding complex concepts. By modelling data points and their relationships using a knowledge graph, businesses can make better decisions that lead to increased profits.
How can knowledge graph & machine learning can be used together?
There are many different ways in which knowledge graph and machine learning can be used together. The following represents some of them:
- Feature engineering is the process of transforming raw data into features that can be used by a machine learning algorithm. Knowledge graphs can be used to extract features from data points that are not easily measured or quantified. For example, a knowledge graph can be used to identify the relationships between different products, and the features extracted could include things like price, weight, and dimensions. An example of how knowledge graph can aid in feature extraction in machine learning would be if a company wanted to create a product recommendation system. The knowledge graph could be used to extract features from data points such as customer ratings, prices, and dimensions. This would help the machine learning algorithm to better understand which products are most similar to each other, and make better recommendations. One other example of how knowledge graph can be used to extract features would be if a company wanted to create a system that predicts customer churn. The knowledge graph could be used to extract features from data points such as customer age, tenure, and purchase history. This would help the machine learning algorithm to better understand which customers are most likely to leave, and make predictions accordingly.
- New probabilistic associations: Using knowledge graph, machine learning can be used to create new probabilistic associations. For example, a knowledge graph could be used to identify the relationships between different products. The machine learning algorithm could then use this information to create new probabilistic associations between products, such as which products are most likely to be purchased together. This would help businesses to better understand customer behavior, and make more informed decisions about product design and marketing. The probabilistic association of Bob taking birth in Washington is depicted in the picture shown above.
- Ontologies to vector representation: Write about how knowledge graph can be used with machine learning with ontologies and vector representation Knowledge graphs and machine learning can be used together to create more accurate models. Knowledge graphs can be used to create ontologies, which are a type of classification system that organizes data into groups. Ontologies can be used to vectorize data, which is a process of converting data points into a numerical representation. This representation can then be used by a machine learning algorithm to create a more accurate model. An example of this can be seen in the work of Google Translate. In order to accurately translate between languages, Google Translate uses a knowledge graph to create an ontology of all the possible translations between two languages. This ontology is used to vectorize the text, which allows the machine learning algorithm to better understand the relationships between words in different languages. One way to vectorize data is by using word2vec. Word2vec is a machine learning algorithm that uses a neural network to learn the relationships between words. It can be used to convert knowledge graph ontologies into a vector representation that can be used by a machine learning algorithm.
- Data validation & consistencies: Write about how machine learning and knowledge graph can be used for data validation & consistencies One of the key benefits of using machine learning and knowledge graphs for data validation and consistencies is that it can help to identify errors and inconsistencies in data sets. By understanding the relationships between data points, machine learning can be used to identify inaccuracies and fix them. This can be especially useful for businesses that rely on accurate data for making decisions. Knowledge graphs can also be used to improve the consistency of data sets. By identifying and understanding the relationships between different data points, knowledge graphs can help to ensure that data is consistently formatted and organized. This can be helpful for businesses that need to be able to quickly access accurate data.
Conclusion
Knowledge graphs are a powerful tool for understanding and modeling complex concepts. By using knowledge graphs with machine learning, businesses can create more accurate models and make better decisions. Knowledge graphs can be used to extract features from data points, create ontologies, and vectorize data. Machine learning can then use this information to create more accurate models. This combination of tools can help businesses to better understand customer behavior, identify inaccuracies in data sets, and improve the consistency of their data. If you would like to learn more about Knowledge Graphs and Machine Learning, please contact us. We would be happy to discuss this topic with you in more detail. Thank you for reading!

Check out my latest book titled as First Principles Thinking: Building winning products using first principles thinking.
- Mathematics Topics for Machine Learning Beginners - July 6, 2025
- Questions to Ask When Thinking Like a Product Leader - July 3, 2025
- Three Approaches to Creating AI Agents: Code Examples - June 27, 2025
I found it very helpful. However the differences are not too understandable for me