Author Archives: Ajitesh Kumar
Minimum Description Length (MDL): Formula, Examples
Learning the concepts of Minimum Description Length (MDL) is valuable for several reasons, especially for those involved in statistics, machine learning, data science, and related fields. One of the fundamental problems in statistics and data analysis is choosing the best model from a set of potential models. The challenge is to find a model that captures the essential features of the data without overfitting. This is where methods such as MDL, AIC, BIC, etc. comes to rescue. MDL offers a principled way to balance model complexity against the goodness of fit. This is crucial in many areas, such as machine learning and statistical modeling, where overfitting is a common problem. …
AIC & BIC for Selecting Regression Models: Formula, Examples

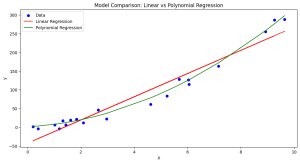
Are you grappling with the complexities of choosing the right regression model for your data? You are not alone. When working with regression models, selecting the most appropriate machine learning model is a critical step toward understanding the relationships between variables and making accurate predictions. With numerous regression models available, it becomes essential to employ robust criteria for model selection. This is where the two most widely used criteria come to the rescue. They are the Akaike Information Criterion (AIC) and the Bayesian Information Criterion (BIC). In this blog, we will learn about the concepts of AIC, BIC and how they can be used to select the most appropriate machine …
Linear Regression Datasets: CSV, Excel

Linear regression is a fundamental machine learning algorithm that helps in understanding the relationship between independent and dependent variables. It is widely used in various fields for predicting numerical outcomes based on one or more input features. To practice and learn about linear regression, it is essential to have access to good quality datasets. In this blog, we have compiled a list of 17 datasets suitable for training linear regression models, available in CSV or easily convertible to CSV (Excel) format. I have also provided a sample Python code you can use to train using these datasets. List of Dataset for Training Linear Regression Models The following is a list …
Pearson vs Spearman: Choosing the Right Correlation Coefficient
Are you as a data scientist trying to decipher relationship between two or more variables within vast datasets to solve real-world problems? Whether it’s understanding the connection between physical exercise and heart health, or the link between study habits and exam scores, uncovering these relationships is crucial. But with different methods at our disposal, how do we choose the most suitable one? This is where the concept of correlation comes into play, and particularly, the choice between Pearson and Spearman correlation coefficients becomes pivotal. The Pearson correlation coefficient is the go-to metric when both variables under consideration follow a normal distribution, assuming there’s a linear relationship between them. Conversely, the …
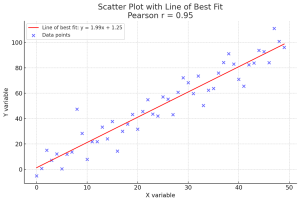
Pearson Correlation Coefficient: Formula, Examples
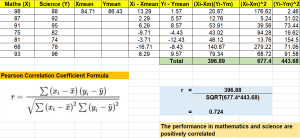
In the world of data science, understanding the relationship between variables is crucial for making informed decisions or building accurate machine learning models. Correlation is a fundamental statistical concept that measures the strength and direction of the relationship between two variables. However, without the right tools and knowledge, calculating correlation coefficients and p-values can be a daunting task for data scientists. This can lead to suboptimal decision-making, inaccurate predictions, and wasted time and resources. In this post, we will discuss what Pearson’s r represents, how it works mathematically (formula), its interpretation, statistical significance, and importance for making decisions in real-world applications such as business forecasting or medical diagnosis. We will …
t-distribution vs Normal distribution: Differences, Examples
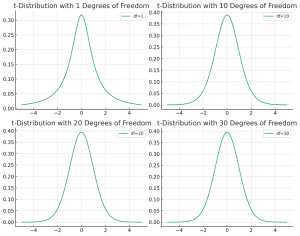
Understanding the differences between the t-distribution and the normal distribution is crucial for anyone delving into the world of statistics, whether they’re students, professionals in research, or data enthusiasts trying to make sense of the world through numbers. But why should one care about the distinction between these two statistical distributions? The answer lies in the heart of hypothesis testing, confidence interval estimation, and predictive modeling. When faced with a set of data, choosing the correct distribution to describe it can greatly influence the accuracy of your conclusions. The normal distribution is often the default assumption due to its simplicity and the central limit theorem, which states that the means …
First Principles Thinking using ChatGPT

Have you ever wondered why an object such as a chair is shaped the way it is, or why it’s even needed in the first place? What mystery unravels when we dig into the very essence of everyday objects and concepts around us? Navigating through a universe having well-established beliefs and customary wisdom, the hunt for innovative answers and deciphering the secrets hidden behind the everyday becomes not just a curiosity, but a necessity. This is where first principles thinking comes to the rescue. I have posted a detailed blog on First principles thinking – First principles thinking: Concepts & Examples. In this blog, let’s explore how we can utilize …
Generative AI Framework for Product Managers: Examples
Ever wondered how you as a product manager can stay ahead in the competitive era fuelled by technological advancements such as generative AI? Are you constantly grappling with the pressure to deliver groundbreaking solutions in line with your business goals? As a product manager, wouldn’t it be revolutionary to have some kind of a playbook that simplifies these challenges? What exactly can generative AI do for modern product managers? Which areas of your daily struggles can it alleviate, and what AI frameworks are best suited for your unique challenges? In this blog, we will dive into the potential of Generative AI vis-a-vis real-life use cases for product managers. Use Cases: …
Problems with Categorical Variables: Examples

Have you ever encountered unfamiliar words while learning a new language and didn’t know their meanings? Or tried to fit all your belongings into a suitcase, only to realize it’s too full? Or started reading a book series from the third book and felt lost? These scenarios in our daily lives surprisingly resemble some challenges we face with categorical variables in machine learning. Categorical variables, while essential in many datasets, bring with them a unique set of challenges. In this article, we’ll be discussing three major problems associated with categorical features: Let’s explore each with real-life examples and supporting Python code snippets. Incomplete Vocabulary The “Incomplete Vocabulary” problem arises when …
Central Tendency in Machine Learning: Python Examples
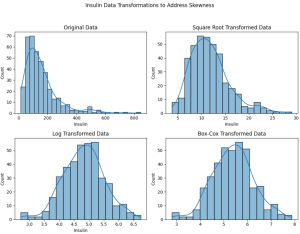
Have you ever wondered why your machine learning model is not performing as expected? Could the “average” behavior of your dataset be misleading your model? How does the “central” or “typical” value of a feature influence the performance of a machine learning model? In this blog, we will explore the concept of central tendency, its significance in machine learning, and the importance of addressing skewness in your dataset. All of this will be demonstrated with the help of Python code examples using a diabetes dataset. We will be working with the diabetes dataset which can be found on Kaggle – Diabetes Dataset. The dataset consists for multiple columns such as …
Data Analytics for Car Dealers: Actionable Insights
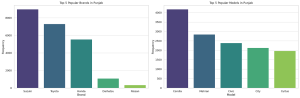
Are you starting a car dealership and wondering how to leverage data to make informed business decisions? In today’s data-driven world, analytics can be the difference between a thriving business and a failing one. This blog aims to provide actionable insights for car dealers, especially those starting new car dealer business, to excel in various business aspects. I will cover inventory management, pricing strategy, marketing and sales, customer service, and risk mitigation, all backed by data analytics. I will continue to update this blog with more methods in time to come. The data used for analysis can be found on the Kaggle.com – Ultimate Car Price Prediction Dataset. First and …
Unemployment Data & Actionable Insights Examples
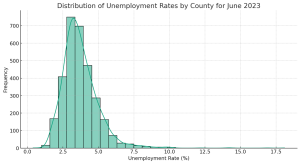
Unemployment figures often flood the news, painting a broad picture of economic stability or crisis. But have you ever wondered how these rates break down at the local level? Do certain counties (or cities) in different states fare better or worse than the national average, and if so, why? Unemployment is a critical indicator of economic health and social well-being. While national or state-level unemployment rates often make headlines, diving deeper into county-level or city level data can offer valuable insights for local governments, policymakers, and social organizations. In this blog, we will explore a dataset that provides unemployment rates for various U.S. counties in June 2023. Along the way, …
Insurance & Linear Regression Model Example
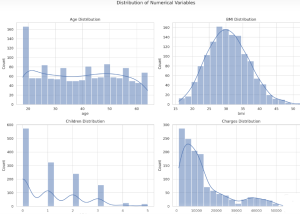
Ever wondered how insurance companies determine the premiums you pay for your health insurance? Predicting insurance premiums is more than just a numbers game—it’s a task that can impact millions of lives. In this blog, we’ll demystify this complex process by walking you through an end-to-end example of predicting health insurance premium charges by demonstrating with Python code example. Specifically, we’ll use a linear regression model to predict these charges based on various factors like age, BMI, and smoking status. Whether you’re a beginner in data science or a seasoned professional, this blog will offer valuable insights into building and evaluating regression models. What is Linear Regression? Linear Regression is …
Chi-square test – Formula, Concepts, Examples
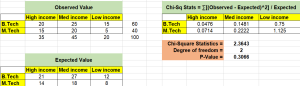
The Pearson’s Chi-square (χ2) test is a statistical test used to determine whether the distribution of observed data is consistent with the distribution of data expected under a particular hypothesis. The Chi-square test can be used to compare or evaluate the independence of two distributions, or to assess the goodness of fit of a given distribution to observed data. In this blog post, we will discuss different types of Chi-square tests, the concepts behind them, and how to perform them using Python / R. As data scientists, it is important to have a strong understanding of the Chi-square test so that we can use it to make informed decisions about …
Text Clustering Real-World Applications: Examples
How often have you wondered about the vast amounts of unstructured data around us and its untapped potential? How can businesses sift through thousands of customer reviews, documents, or feedback to derive actionable insights? What if there was a way to automatically group similar pieces of text, helping organizations quickly identify patterns and trends? Enter text clustering. A subset of text analytics, text clustering is an unsupervised machine learning task that divides a set of texts into clusters or groups. This ensures that texts in the same group are more similar to each other than to those in other groups. A powerful tool for deciphering insights from unstructured data, text …
Contract Analysis & Review Checklist: Questions, Examples
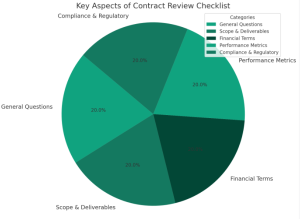
Have you ever found yourself knee-deep in contractual jargon, wondering if you’ve missed a critical clause that could cost your organization thousands or even millions? How confident are you that every contract your team signs is optimized for both performance and cost efficiency? If you’re a procurement stakeholder, a category manager, or a contract specialist, these questions are not just hypothetical—they’re the daily challenges you face. In this blog, you will learn about a structured approach to learning, understanding, and reviewing contracts, minimizing risks, and maximizing value based on asking the right kind of questions. We delve into key questions you should be asking, highlight essential clauses to scrutinize, and …
I found it very helpful. However the differences are not too understandable for me