Author Archives: Ajitesh Kumar
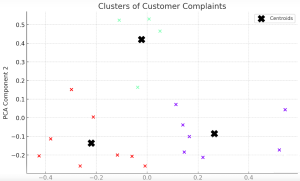
Text Clustering Real-World Applications: Examples
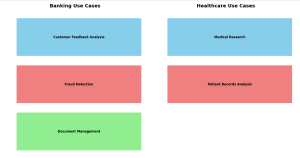
How often have you wondered about the vast amounts of unstructured data around us and its untapped potential? How can businesses sift through thousands of customer reviews, documents, or feedback to derive actionable insights? What if there was a way to automatically group similar pieces of text, helping organizations quickly identify patterns and trends? Enter text clustering. A subset of text analytics, text clustering is an unsupervised machine learning task that divides a set of texts into clusters or groups. This ensures that texts in the same group are more similar to each other than to those in other groups. A powerful tool for deciphering insights from unstructured data, text …
Contract Analysis & Review Checklist: Questions, Examples
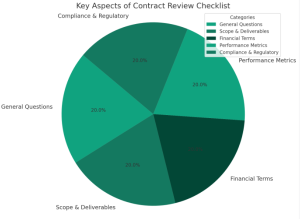
Have you ever found yourself knee-deep in contractual jargon, wondering if you’ve missed a critical clause that could cost your organization thousands or even millions? How confident are you that every contract your team signs is optimized for both performance and cost efficiency? If you’re a procurement stakeholder, a category manager, or a contract specialist, these questions are not just hypothetical—they’re the daily challenges you face. In this blog, you will learn about a structured approach to learning, understanding, and reviewing contracts, minimizing risks, and maximizing value based on asking the right kind of questions. We delve into key questions you should be asking, highlight essential clauses to scrutinize, and …
Find Topics of Text Clustering: Python Examples
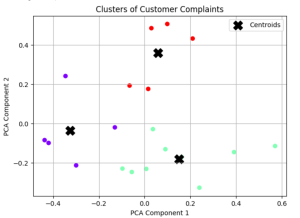
Have you ever clustered a collection of texts and wondered what predominant topics underlie each group? How can you pinpoint the essence of each cluster comprising of large volume of words? Is there a way to succinctly represent the core topic of each cluster using Python? Text clustering is a powerful technique in natural language processing (NLP) that groups documents into clusters based on their content. Once you’ve clustered your data, a natural follow-up question arises: “What are these clusters about?” In this article, we’ll discuss two different methods to find the dominant topics of text clusters using Python. Meanwhile, check out my post on text clustering – Text Clustering …
Productivity vs Efficiency: Differences, Examples
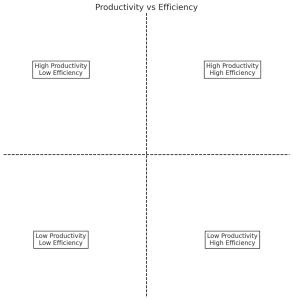
If you’ve ever found yourself caught in the whirlwind of tasks and deadlines, you’ve probably asked yourself: “How can I get more done?” or “How can I make better use of my time?” At the core of these questions lie two concepts that are often used interchangeably but are fundamentally different: Productivity and Efficiency. Understanding the nuances between productivity and efficiency can be a game-changer in both your personal and professional life. While both are geared towards improving performance and achieving goals, they focus on different aspects of the work process. Knowing when to prioritize one over the other can mean the difference between spinning your wheels and skyrocketing your …
OpenAI Python API Example for NLP Tasks
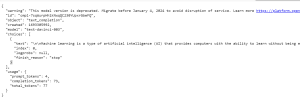
Ever wondered how you can leverage the power of OpenAI’s GPT-3 and GPT-3.5 (from Jan 2024 onwards) directly in your Python application? Are you curious about generating human-like text with just a few lines of code? This blog post will walk you through an example Python code snippet that utilizes OpenAI’s Python API for different NLP tasks such as text generation. Check out my other post on how to use Langchain framework for text generation using OpenAI GPT models. OpenAI Python APIs The OpenAI Python API is an interface that allows you to interact with OpenAI’s language models, including their GPT-3 model. The following are different popular models that you …
Architecting a Generative AI Platform for GPT-based LLM Apps
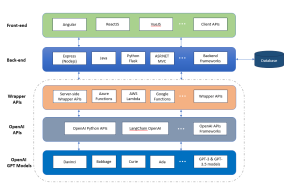
Have you ever wondered how to build a scalable Generative AI platform based on OpenAI GPT models that can serve different applications? Are you a data scientist, product manager, or software engineer looking to understand the intricacies of the architecture of such a scalable generative AI platform? This blog aims to demystify the architectural building blocks needed to create a robust GPT-based platform. By the end, you will have a clear roadmap for architecting, designing, and implementing your own GPT-based large language models (LLMs) applications platform. Generative AI Platform Architecture for GPT-based LLM Apps The following is the technology architecture of generative AI platform which can leverage OpenAI GPT based …
Microsoft’s Free Courses: Data Science, Machine Learning, AI
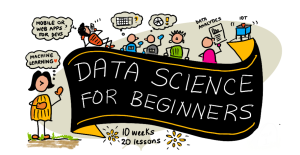
Are you keen on diving into the world of data science, machine learning, or artificial intelligence? Have you been searching for courses that not only teach the fundamentals but are also free and accessible? Look no further! Microsoft has put together three distinct courses that will cater to your interests and ignite your passion for learning. Data Science for Beginners This course offers an ideal starting point for those new to data science, focusing on the basics and guiding through practical exercises. The course would help you demystify the complex world of data, allowing you to make informed decisions in various fields such as business, healthcare, and more. Each lesson …
Text Clustering Python Examples: Steps, Algorithms
Text clustering has swiftly emerged as a cornerstone in data-driven decision-making across industries. But what exactly is text clustering, and how can it transform the way businesses operate? How does it convert unstructured text into actionable insights? What are the core steps involved in text clustering, and how are they interlinked? What algorithms are pivotal in implementing text clustering effectively? In this blog, we will unravel these questions, diving deep into the systematic steps of text clustering, its underlying algorithms, and real-world examples that bring this technique to life. Whether you’re a product manager seeking to leverage data analytics or a data scientist curious to learn key steps of text …
Topic Modeling LDA Python Example
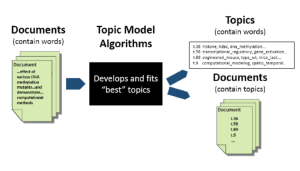
Are you overwhelmed by the endless streams of text data and looking for a way to unearth the hidden themes that lie within? Have you ever wondered how platforms like Google News manage to group similar articles together, or how businesses extract insights from vast volumes of customer reviews? The answer to these questions might be simpler than you think, and it’s rooted in the world of Topic Modeling. Introducing Latent Dirichlet Allocation (LDA) – a powerful algorithm that offers a solution to the puzzle of understanding large text corpora. LDA is not just a buzzword in the data science community; it’s a mathematical tool that has found applications in …
Encoder Only Transformer Models Quiz / Q&A

Are you intrigued by the revolutionary world of transformer architectures? Have you ever wondered how encoder-only transformer models like BERT, ELECTRA, or DeBERTa have reshaped the landscape of Natural Language Processing (NLP)? The rapid advancement of machine learning has led to the creation of numerous transformer architectures, each with unique features, applications, and underlying mechanics. Whether you’re a data scientist, machine learning engineer, generative AI enthusiast, or a student eager to deepen your understanding, this quiz offers an engaging and informative way to assess your knowledge and sharpen your skills. It would also help you prepare for your interviews on this topic. Encoder-only transformer models have become a cornerstone in …
Actionable Insights: Examples & Concepts
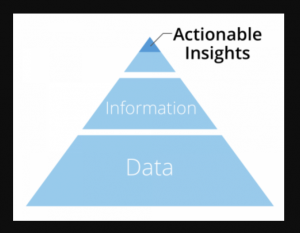
The idea of actionable insights is something that has gone mainstream across different departments in any and every business due to the onset of decision-centric analytics and digital transformation initiatives at large. Today, actionable insights are at the heart of many successful business decisions, and are used to help companies grow further than ever before. Actionable insights are key to any data analytics initiatives including decision-centric analytics which are at the heart of digital transformation. Analytics centered around actionable insights can also be termed as actionable analytics. In this blog post, we will understand the concepts of actionable insights with the help of examples along with few actionable analytics tools …
Hypothesis Testing Steps & Examples
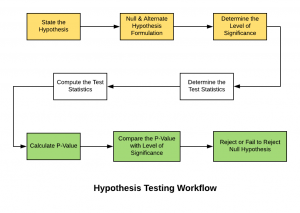
Hypothesis testing is a technique that helps scientists, researchers, or for that matter, anyone test the validity of their claims or hypotheses about real-world or real-life events in order to establish new knowledge. Hypothesis testing techniques are often used in statistics and data science to analyze whether the claims about the occurrence of the events are true, whether the results returned by performance metrics of machine learning models are representative of the models or they happened by chance. This blog post will cover some of the key statistical concepts including steps and examples in relation to what is hypothesis testing, how to formulate them and how to use them in …
OpenAI GPT-3 Models List: Explained with Examples
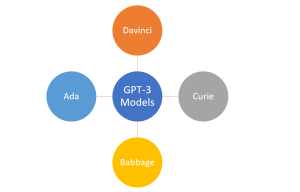
In the ever-evolving landscape of natural language processing (NLP), OpenAI’s GPT-3 models have garnered significant attention for how they could understand and generate human-like text. Different GPT-3 models discussed in this blog can be accessed using APIs and OpenAI Playground. In this blog post, we will delve into the OpenAI GPT-3 models and provide a comprehensive list, along with explanations and examples of their capabilities. Although GPT-3.5 models are more powerful than their counterpart GPT-3 models, it is only these GPT-3 models which are currently available for fine-tuning. Whether you are an experienced data scientist or a curious generative ai enthusiast, understanding these models is crucial in making the most …
LLM Chain OpenAI Python Example
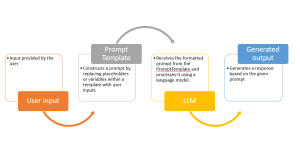
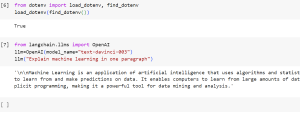
Have you ever wondered how to fully utilize large language models (LLMs) in our natural language processing (NLP) applications, like we do with ChatGPT? Would you not want to create an application such as ChatGPT where you write some prompt and it gives you back output such as text generation or summarization. While learning to make a direct API call to an OpenAI LLMs is a great start, we can build full fledged applications serving our end user needs. And, building prompts that adapt to user input dynamically is one of the most important aspect of an LLM app. That’s where LangChain, a powerful framework, comes in. In this blog, …
Langchain ChatGPT Hello World Python Example
Have you ever wondered how to build applications that not only utilize large language models (LLMs) but are also capable of interacting with their environment and connecting to other data sources. If so, then LangChain is the answer! In this blog, we will learn about what is LangChain, what are its key aspects, how does it work. We will also quickly review the concepts of prompt, tokens and temperature when using the OpenAI API. We will the learn about creating a ‘Hello World’ Python program using LangChain and OpenAI’s Large Language Models (LLMs) such as GPT-3 models. What is LangChain Framework? LangChain is a dynamic framework specifically designed for the …
Huggingface Arxiv Dataset: Python Example

Working with large and specific datasets is a common requirement in the field of natural language processing (NLP) and machine learning. The Arxiv dataset, containing metadata such as titles, abstracts, years, and categories of research papers, is an invaluable resource for researchers and data scientists. How can we easily load this dataset and extract the required information? In this blog post, we will explore a Python example using the Hugging Face library to load the Arxiv dataset and extract specific metadata. Python Code for Loading Huggingface Arxiv Dataset The following are the steps to load Hugging face Arxiv dataset using python code: Real-World Application Use Cases: Analyzing Research Papers Imagine …
I found it very helpful. However the differences are not too understandable for me