
Are you starting a car dealership and wondering how to leverage data to make informed business decisions? In today’s data-driven world, analytics can be the difference between a thriving business and a failing one. This blog aims to provide actionable insights for car dealers, especially those starting new car dealer business, to excel in various business aspects. I will cover inventory management, pricing strategy, marketing and sales, customer service, and risk mitigation, all backed by data analytics. I will continue to update this blog with more methods in time to come.
The data used for analysis can be found on the Kaggle.com – Ultimate Car Price Prediction Dataset. First and foremost, download the dataset and load it in your Jupyter notebook for doing data analytics. Here is the Python code:
# Import necessary libraries
import pandas as pd

# Load the dataset
file_path = '/path/Clean Data_pakwheels.csv'
df = pd.read_csv(file_path)

# Show basic summary information about the dataset
summary_info = df.describe(include='all')
summary_info.head()
Inventory Management
Choosing the right inventory is the first step in making your car dealership a success. But how do you decide which cars are likely to sell? That’s where data analytics comes in. In the dataset, there are six unique locations. I will cover the example of setting up a car dealership business in Punjab location.
Let’s say you’re starting a car dealership in Punjab. You might want to know which car brands and models are most popular in the area to stock your inventory accordingly. The following code can be used:
# Filtering data to include only listings from Punjab
df_punjab = df[df['Location'] == 'Punjab']

# Finding the most popular brands and models
popular_brands = df_punjab['Company Name'].value_counts().head(5)
popular_models = df_punjab['Model Name'].value_counts().head(5)
Based on our data, Suzuki and Corolla are highly popular in Punjab. We can decide on prioritizing stocking up on these models and brands. This can also be seen visually in the plot below.
import matplotlib.pyplot as plt
import seaborn as sns

# Setting up the visual style
sns.set(style="whitegrid")

# Filter data for Punjab location
df_punjab = df[df['Location'] == 'Punjab']

# Find the top 5 popular brands and models in Punjab
top_brands = df_punjab['Company Name'].value_counts().head(5)
top_models = df_punjab['Model Name'].value_counts().head(5)

# Plotting the bar charts
fig, axes = plt.subplots(1, 2, figsize=(18, 6))

# Bar chart for top 5 popular brands
sns.barplot(x=top_brands.index, y=top_brands.values, ax=axes[0], palette="viridis")
axes[0].set_title('Top 5 Popular Brands in Punjab')
axes[0].set_xlabel('Brand')
axes[0].set_ylabel('Frequency')

# Bar chart for top 5 popular models
sns.barplot(x=top_models.index, y=top_models.values, ax=axes[1], palette="viridis")
axes[1].set_title('Top 5 Popular Models in Punjab')
axes[1].set_xlabel('Model')
axes[1].set_ylabel('Frequency')

plt.tight_layout()
plt.show()
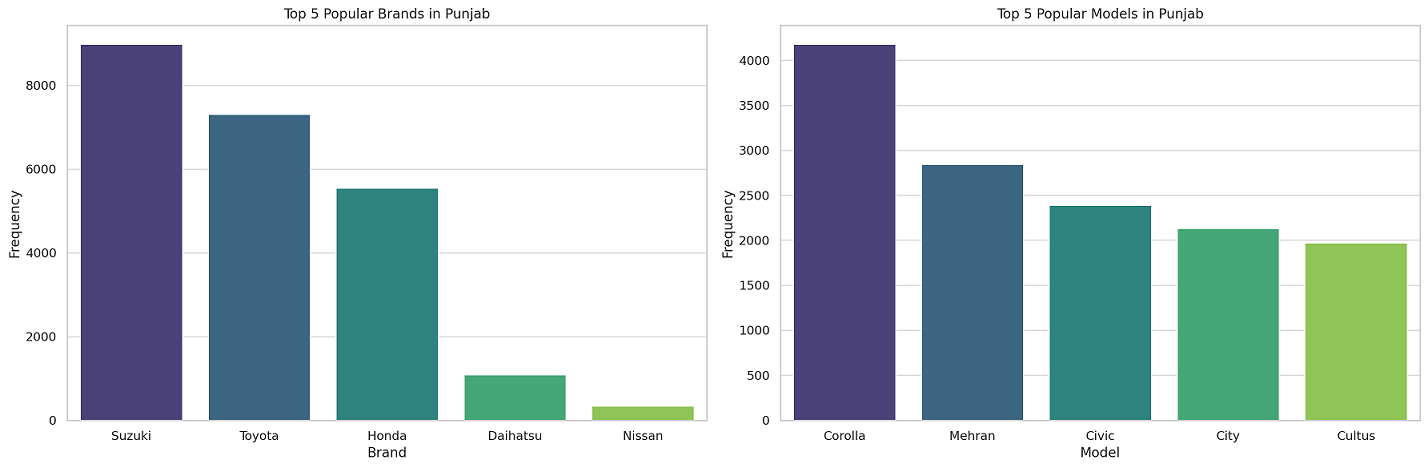
Top 5 Popular Brands in Punjab
The bar chart on the left shows the top 5 popular car brands in Punjab. Suzuki leads the chart, followed by Toyota, Honda, Daihatsu, and Mitsubishi. Knowing which brands are most popular can guide you in deciding which cars to keep in your inventory.
Top 5 Popular Models in Punjab
The bar chart on the right highlights the top 5 car models in Punjab, with Corolla taking the top spot. Other popular models include Mehran, Civic, Alto, and Cultus. This information is crucial for understanding consumer preference and can significantly influence your inventory choices.
Pricing Strategy
Setting the right price can be the difference between making a sale and losing a potential customer. To set competitive prices, we need to know the average price of cars in Punjab. We can take median price as well.
# Calculating the average price
average_price = df_punjab['Price'].mean()
The average car price in Punjab is approximately 1.9 million units. We will price the cars around this average to be competitive.
We will do some more detailed analysis for pricing strategy. The ask is how do we set the pricing of the car models.
# Setting up the visual style
sns.set(style="whitegrid")

# Prepare the data for visualization
df_punjab_filtered = df_punjab[df_punjab['Price'] < df_punjab['Price'].quantile(0.99)]  # Removing extreme outliers for better visualization

# Plotting the visualizations
fig, axes = plt.subplots(1, 2, figsize=(18, 6))

# Boxplot for Price Ranges
sns.boxplot(x="Company Name", y="Price", data=df_punjab_filtered[df_punjab_filtered['Company Name'].isin(top_brands.index)], ax=axes[0])
axes[0].set_title('Boxplot of Car Prices by Brand in Punjab')
axes[0].set_xlabel('Brand')
axes[0].set_ylabel('Price')
axes[0].tick_params(axis='x', rotation=45)

# Scatter Plot for Year vs. Price
sns.scatterplot(x="Model Year", y="Price", hue="Company Name", data=df_punjab_filtered[df_punjab_filtered['Company Name'].isin(top_brands.index)], ax=axes[1])
axes[1].set_title('Scatter Plot of Car Prices vs. Model Year in Punjab')
axes[1].set_xlabel('Model Year')
axes[1].set_ylabel('Price')

plt.tight_layout()
plt.show()
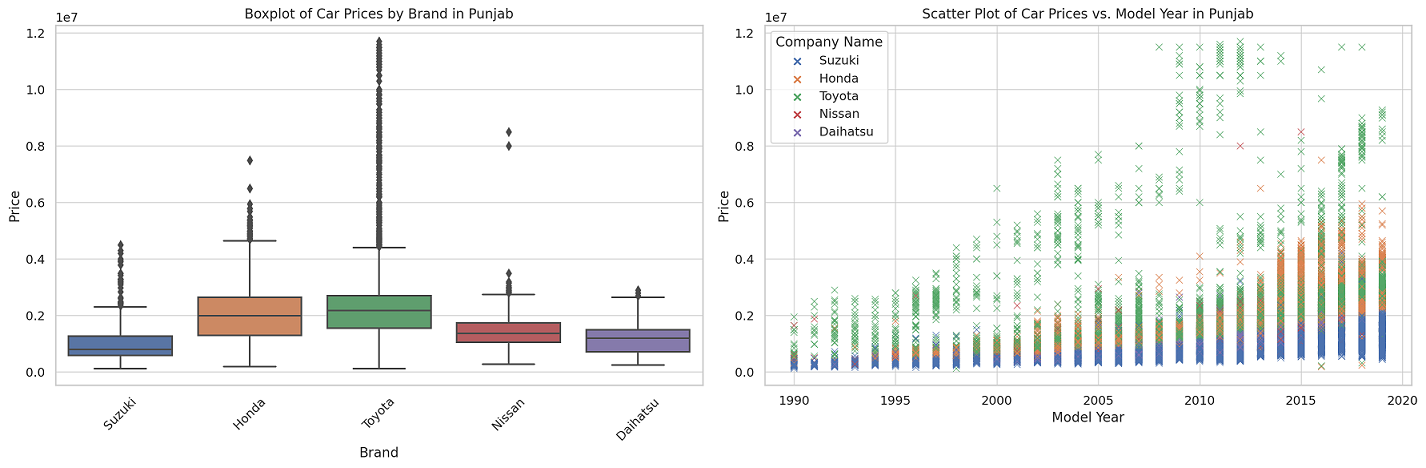
Based on the visualizations and data insights, here are some pricing strategies you could consider for your car dealership in Punjab:
Pricing by Brand
- Budget-Friendly Inventory: Suzuki cars are generally priced lower than Toyota and Honda. If you’re targeting a more budget-conscious audience, consider having a variety of Suzuki models.
- Premium Inventory: Toyota and Honda cars generally fall within a higher price range. Stocking these brands would cater to a more premium market.
- Competitive Pricing: Use the boxplot’s median prices for each brand as a benchmark for setting your prices. You can price slightly lower than the median to attract cost-sensitive customers.
- Outliers and Special Editions: The boxplot also shows outliers, which are usually special or limited editions. You might choose to have a few of these as they can attract enthusiasts willing to pay a premium.
Pricing by Model Year
- Newer Models at Premium: The scatter plot shows that newer models are generally priced higher. You could follow a similar strategy, pricing the latest models at a premium.
- Depreciation-Based Pricing: For older models, consider a depreciation-based pricing strategy. You could lower the price of older models to clear out inventory or attract budget-conscious buyers.
- Price Banding: You might also consider setting price bands for different years. For instance, all cars from 2015-2020 could fall within a certain price range, while older models could be priced lower.
Marketing and Sales
Successful marketing is about reaching the right people with the right message. Knowing customer preferences can help target your marketing more effectively.
# Finding the most popular engine types and body styles
popular_engine_types = df_punjab['Engine Type'].value_counts().head(3)
popular_body_types = df_punjab['Body Type'].value_counts().head(3)
The recommendation is to highlight features like petrol engines and hatchback body types in our marketing, as they are most popular in Punjab.
Customer Service
Excellent customer service can set you apart from competitors. Most cars in Punjab are already registered. Offering registration services could be a value-added service.
# Finding the number of already registered cars
registered_cars = df_punjab['Registration Status'].value_counts()['Registered']
The recommendation is to offer registration services to attract more customers, as most cars are already registered in Punjab.
Risk Assessment
Knowing the average mileage can serve as a baseline for assessing the wear and tear on used cars. The idea is to be cautious when purchasing or selling cars with high mileage, as they could require more maintenance.
# Calculating the average mileage
average_mileage = df_punjab['Mileage'].mean()
The average mileage is around 89,343. This can be used as a baseline to assess the condition of used cars.
Conclusion
Data analytics can guide through each step of your car dealership business, from inventory management to customer service. By leveraging data, you can make informed decisions that will set you up for success, especially if you’re starting your business in a competitive market.

Check out my latest book titled as First Principles Thinking: Building winning products using first principles thinking.
- Three Approaches to Creating AI Agents: Code Examples - June 27, 2025
- What is Embodied AI? Explained with Examples - May 11, 2025
- Retrieval Augmented Generation (RAG) & LLM: Examples - February 15, 2025
I found it very helpful. However the differences are not too understandable for me