Author Archives: Ajitesh Kumar
Pandas Dataframe vs Numpy Array: What to Use?

In this post, you will learn about which data structure to use between Pandas Dataframe and Numpy Array when working with Scikit Learn libraries. As a data scientist, it is very important to understand the difference between Numpy array and Pandas Dataframe and when to use which data structure. Here are some facts: Scikit learn was originally developed to work well with Numpy array Numpy Ndarray provides a lot of convenient and optimized methods for performing several mathematical operations on vectors. Numpy array can be instantiated using the following manner: np.array([4, 5, 6]) Pandas Dataframe is an in-memory 2-dimensional tabular representation of data. In simpler words, it can be seen …
Visualize Decision Tree with Python Sklearn Library
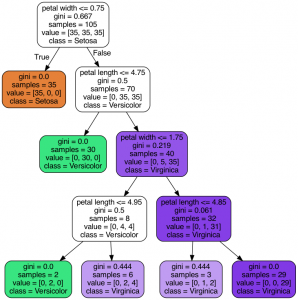
In this post, you will learn about different techniques you can use to visualize decision tree (a machine learning algorithm) using Python Sklearn (Scikit-Learn) library. The python code example would use Sklearn IRIS dataset (classification) for illustration purpose. The decision tree visualization would help you to understand the model in a better manner. The following are two different techniques which can be used for creating decision tree visualisation: Sklearn tree class (plot_tree method) Graphviz library Sklearn Tree Class for Visualization In this section, you will see the code sample for creating decision tree visualization using Sklearn Tree method plot_tree method. Sklearn IRIS dataset is used for training the model. Here is …
Decision Tree Classifier Python Code Example
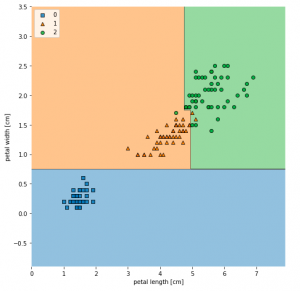
In this post, you will learn about how to train a decision tree classifier machine learning model using Python. The following points will be covered in this post: What is decision tree? Decision tree python code sample What is Decision Tree? Simply speaking, the decision tree algorithm breaks the data points into decision nodes resulting in a tree structure. The decision nodes represent the question based on which the data is split further into two or more child nodes. The tree is created until the data points at a specific child node is pure (all data belongs to one class). The criteria for creating the most optimal decision questions is …
How to Convert Sklearn Dataset to Dataframe

In this post, you will learn how to convert Sklearn.datasets to Pandas Dataframe. It will be useful to know this technique (code example) if you are comfortable working with Pandas Dataframe. You will be able to perform several operations faster with the dataframe. Sklearn datasets class comprises of several different types of datasets including some of the following: Iris Breast cancer Diabetes Boston Linnerud Images The code sample below is demonstrated with IRIS data set. Before looking into the code sample, recall that IRIS dataset when loaded has data in form of “data” and labels present as “target”. Executing the above code will print the following dataframe. In case, you don’t want to explicitly assign …
Machine Learning – SVM Kernel Trick Example
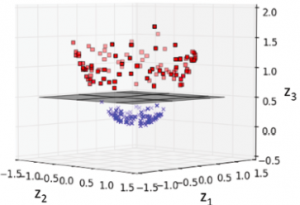
In this post, you will learn about what are kernel methods, kernel trick, and kernel functions when referred with a Support Vector Machine (SVM) algorithm. A good understanding of kernel functions in relation to the SVM machine learning (ML) algorithm will help you build/train the most optimal ML model by using the appropriate kernel functions. There are out-of-box kernel functions such as some of the following which can be applied for training models using the SVM algorithm: Polynomial kernel Gaussian kernel Radial basis function (RBF) kernel Sigmoid kernel The following topics will be covered: Background – Why Kernel concept? What is a kernel method? What is the kernel trick? What are …
Google Technical Writing Course – Cheat Sheet

In this post, you will quickly learn about key learning from free course on Technical writing by Google. Define new or unfamiliar terms: When writing or editing, learn to recognize terms that might be unfamiliar to some or all of your target audience. If the term already exists, link to a good existing explanation. In case your document is introducing the term, define the term properly. Use acronyms properly: On the initial use of an unfamiliar acronym within a document or a section, spell out the full term, and then put the acronym in parentheses. Active voice vs Passive voice: Prefer active voice to the passive voice Clear Sentences Choose strong verbs …
Flutter Flexible Widget Example with Row
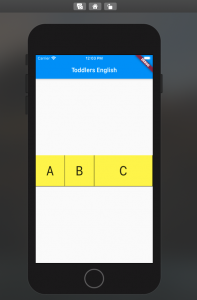
In this post, you will learn about how to use Flexible Widget to ensure equal spacing for children of Row. Flexible is a widget that controls how a child of a Row, Column, or Flex flexes. In this post, we will see how to use a Flexible widget to control the width of the children’s widget contained in the Row widget. Look at each of the rows in the app below consisting of 4 letters of the English Alphabet. In case we don’t use a Flexible widget, we may have to assign the width of each of the containers (represented using commented cell width in the code below. However, using a Flexible widget, there is no need for the …
Flutter Row Concepts with Code Example
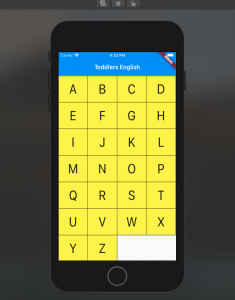
In this post, you will learn about Flutter Row concepts with code example. Flutter Row is a flex widget that lets you create flexible layouts in the horizontal directions. The design of these objects is based on the web’s flexbox layout model. In other words, Row is a widget that displays its children in a horizontal array. In this post, you will see how to build a UI such as below using Flutter Row widget. In order to achieve above, a stateless widget namely AlphabetWidget is created whose build method is used to build the above UI widgets. Here is the code for AlphabetWidget. In the above code example, pay …
Sklearn SVM Classifier using LibSVM – Code Example
In this post, you learn about Sklearn LibSVM implementation used for training an SVM classifier, with code example. Here is a great guide for learning SVM classification, especially, for beginners in the field of data science/machine learning. LIBSVM is a library for Support Vector Machines (SVM) which provides an implementation for the following: C-SVC (Support Vector Classification) nu-SVC epsilon-SVR (Support Vector Regression) nu-SVR Distribution estimation (one-class SVM) In this post, you will see code examples in relation to C-SVC, and nu-SVC LIBSVM implementations. I will follow up with code examples for SVR and distribution estimation in future posts. Here are the links to their SKLearn pages for C-SVC and nu-SVC …
Flutter – How to Create Dart Object from JSON
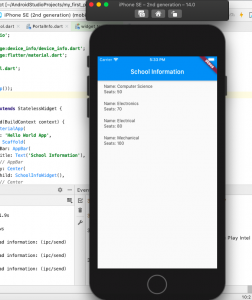
In this post, we will understand the concepts in relation to creating a Dart object from a JSON object and how to use these DART objects in Flutter app. We will build an app and run the code shown in this post. Here is an example JSON object which we will work with, in order to create a custom Dart object called as School. The JSON represents information about a school including name, address, departments. You may note that the JSON object is primarily of type Map<String, dynamic> where key is String and value is of dynamic type. The key, name, is of type <String, String>, the key, address, is of …
SVM – Understanding C Value with Code Examples
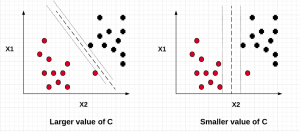
In this post, we will understand the importance of C value on the SVM soft margin classifier overall accuracy using code samples. In the previous post titled as SVM as Soft Margin Classifier and C Value, the concepts around SVM soft margin classifier and the importance of C value was explained. If you are not sure about the concepts, I would recommend reading earlier article. Lets take a look at the code used for building SVM soft margin classifier with C value. The code example uses the SKLearn IRIS dataset In the above code example, take a note of the value of C = 0.01. The model accuracy came out to …
SVM as Soft Margin Classifier and C Value
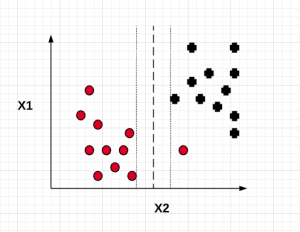
In this post, you will learn about SVM (Support Vector Machine) as Soft Margin Classifier and the importance of Value of C. In the previous post, we learned about SVM as maximum margin classifier. What & Why of SVM as Soft Margin Classifier? Before getting into understanding what is Soft Margin Classifier version of SVM algorithm, lets understand why we need it when we had a maximum margin classifier. Maximum margin classifier works well with linearly separable data such as the following: When maximum margin classifier is trained on the above data set with maximum distance (margin) between the closest points (support vectors), we can get a hyperplane which can separate the data in a clear …
Flutter – Map String Dynamic Code Example

In this post, we will understand the Flutter concepts related to Map<String, Dynamic> with some code example / sample. For greater details, visit Flutter website. Map<String, dynamic> maps a String key with the dynamic value. Since the key is always a String and the value can be of any type, it is kept as dynamic to be on the safer side. It is very useful in reading a JSON object as the JSON object represents a set of key-value pairs where key is of type String while value can be of any type including String, List<String>, List<Object> or List<Map>. Take a look at the following example: Above is an example of JSON object …
SVM Algorithm as Maximum Margin Classifier
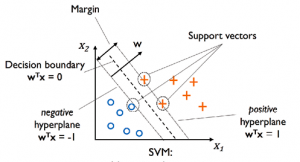
In this post, we will understand the concepts related to SVM (Support Vector Machine) algorithm which is one of the popular machine learning algorithm. SVM algorithm is used for solving classification problems in machine learning. Lets take a 2-dimensional problem space where a point can be classified as one or the other class based on the value of the two dimensions (independent variables, say) X1 and X2. The objective is to find the most optimal line (hyperplane in case of 3 or more dimensions) which could correctly classify the points with most accuracy. In the diagram below, you could find multiple such lines possible. In the above diagram, the objective is to find the …
Security Misconfiguration Example – Upwork
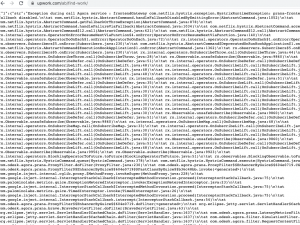
In this post, you will see an example of security misconfiguration which is one of the top 10 security vulnerabilities as per OWASP top 10 security vulnerabilities. Here is what security misconfiguration means? Attackers will often attempt to exploit unpatched flaws or access default accounts, unused pages, unprotected files and directories, etc to gain unauthorized access or knowledge of the system. In this post, you will see the example of unauthorized knowledge of the system. Security Misconfiguration Example This morning, I was checking the Upwork.com when I saw this message when I tried to login. Take a look at exceptions and stack trace. Using the above, I could extract some …


I found it very helpful. However the differences are not too understandable for me