Tag Archives: Data Science
85+ Free Online Books, Courses – Machine Learning & Data Science

This post represents a comprehensive list of 85+ free books/ebooks and courses on machine learning, deep learning, data science, optimization, etc which are available online for self-paced learning. This would be very helpful for data scientists starting to learn or gain expertise in the field of machine learning / deep learning. Please feel free to comment/suggest if I missed mentioning one or more important books that you like and would like to share. Also, sorry for the typos. Following are the key areas under which books are categorized: Data science Pattern Recognition & Machine Learning Probability & Statistics Neural Networks & Deep Learning Optimization Data mining Mathematics Here is my post …
Tensor Explained with Python Numpy Examples
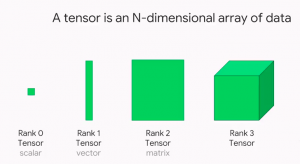
Tensors are a hot topic in the world of data science and machine learning. But what are tensors, and why are they so important? In this post, we will explain the concepts of Tensor using Python Numpy examples with the help of simple explanation. We will also discuss some of the ways that tensors can be used in data science and machine learning. When starting to learn deep learning, you must get a good understanding of the data structure namely tensor as it is used widely as the basic data structure in frameworks such as tensorflow, PyTorch, Keras etc. Stay tuned for more information on tensors! What are tensors, and why are …
Artificial Intelligence (AI) for Telemedicine: Use cases, Challenges
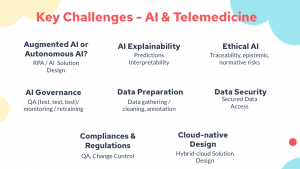
In this post, you will learn about different artificial intelligence (AI) use cases of Telemedicine / Telehealth including some of key implementation challenges pertaining to AI / machine learning. In case you are working in the field of data science / machine learning, you may want to go through some of the challenges, primarily AI related, which is thrown in Telemedicine domain due to upsurge in need of reliable Telemedicine services. What is Telemedicine? Telemedicine is the remote delivery of healthcare services, using digital communication technologies. It has the potential to improve access to healthcare, especially in remote or underserved communities. It can be used for a variety of purposes, including …
Scatter plot Matplotlib Python Example
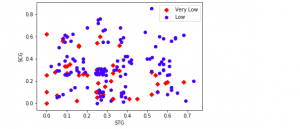
If you’re a data scientist, data analyst or a Python programmer, data visualization is key part of your job. And what better way to visualize all that juicy data than with a scatter plot? Matplotlib is your trusty Python library for creating charts and graphs, and in this blog we’ll show you how to use it to create beautiful scatter plots using examples and with the help of Matplotlib library. So dig into your data set, get coding, and see what insights you can uncover! What is a Scatter Plot? A scatter plot is a type of data visualization that is used to show the relationship between two variables. Scatter …
Weight Decay in Machine Learning: Concepts
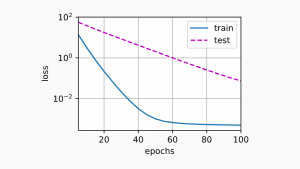
Weight decay is a popular technique in machine learning that helps to improve the accuracy of predictions. In this post, we’ll take a closer look at what weight decay is and how it works. We’ll also discuss some of the benefits of using weight decay and explore some possible applications. As data scientists, it is important to learn about concepts of weight decay as it helps in building machine learning models having higher generalization performance. Stay tuned! What is weight decay and how does it work? Weight decay is a regularization technique that is used to regularize the size of the weights of certain parameters in machine learning models. Weight …
Softmax Regression Explained with Python Example
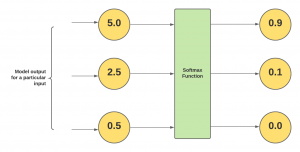
In this post, you will learn about the concepts of what is Softmax regression/function with Python code examples and why do we need them? As data scientist/machine learning enthusiasts, it is very important to understand the concepts of Softmax regression as it helps in understanding the algorithms such as neural networks, multinomial logistic regression, etc in a better manner. Note that the Softmax function is used in various multiclass classification machine learning algorithms such as multinomial logistic regression (thus, also called softmax regression), neural networks, etc. Before getting into the concepts of softmax regression, let’s understand what is softmax function. What’s Softmax function? Simply speaking, the Softmax function converts raw …
Regularization in Machine Learning: Concepts & Examples
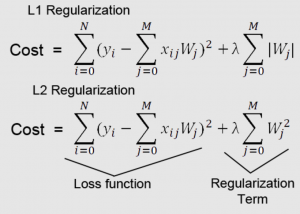
In machine learning, regularization is a technique used to avoid overfitting. This occurs when a model learns the training data too well and therefore performs poorly on new data. Regularization helps to reduce overfitting by adding constraints to the model-building process. As data scientists, it is of utmost importance that we learn thoroughly about the regularization concepts to build better machine learning models. In this blog post, we will discuss the concept of regularization and provide examples of how it can be used in practice. What is regularization and how does it work? Regularization in machine learning represents strategies that are used to reduce the generalization or test error of …
Frequentist vs Bayesian Probability: Difference, Examples
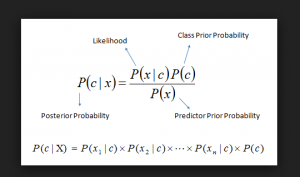
In this post, you will learn about the difference between Frequentist vs Bayesian Probability. It is of utmost importance to understand these concepts if you are getting started with Data Science. What is Frequentist Probability? Probability is used to represent and reason about uncertainty. It was originally developed to analyze the frequency of the events. In other words, the probability was developed as frequentist probability. The probability of occurrence of an event, when calculated as a function of the frequency of the occurrence of the event of that type, is called Frequentist Probability. Frequentist probability is a way of assigning probabilities to events that take into account how often those events actually occur. Frequentist …
SVM Classifier using Sklearn: Code Examples
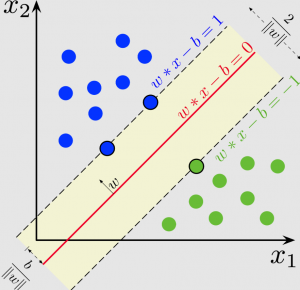
In this post, you will learn about how to train an SVM Classifier using Scikit Learn or SKLearn implementation with the help of code examples/samples. An SVM classifier, or support vector machine classifier, is a type of machine learning algorithm that can be used to analyze and classify data. A support vector machine is a supervised machine learning algorithm that can be used for both classification and regression tasks. The Support vector machine classifier works by finding the hyperplane that maximizes the margin between the two classes. The Support vector machine algorithm is also known as a max-margin classifier. Support vector machine is a powerful tool for machine learning and has been widely used …
Stochastic Gradient Descent Python Example
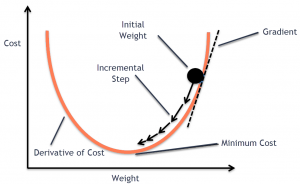
In this post, you will learn the concepts of Stochastic Gradient Descent (SGD) using a Python example. Stochastic gradient descent is an optimization algorithm that is used to optimize the cost function while training machine learning models. The most popular algorithm such as gradient descent takes a long time to converge for large datasets. This is where the variant of gradient descent such as stochastic gradient descent comes into the picture. In order to demonstrate Stochastic gradient descent concepts, the Perceptron machine learning algorithm is used. Recall that Perceptron is also called a single-layer neural network. Before getting into details, let’s quickly understand the concepts of Perceptron and the underlying learning …
Dummy Variables in Regression Models: Python, R
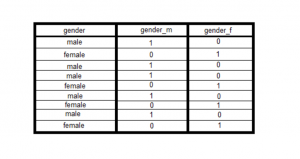
In linear regression, dummy variables are used to represent the categorical variables in the model. There are a few different ways that dummy variables can be created, and we will explore a few of them in this blog post. We will also take a look at some examples to help illustrate how dummy variables work. We will also understand concepts related to the dummy variable trap. By the end of this post, you should have a better understanding of how to use dummy variables in linear regression models. As a data scientist, it is important to understand how to use linear regression and dummy variables. What are dummy variables in …
Linear regression hypothesis testing: Concepts, Examples
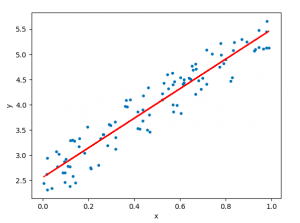
In relation to machine learning, linear regression is defined as a predictive modeling technique that allows us to build a model which can help predict continuous response variables as a function of a linear combination of explanatory or predictor variables. While training linear regression models, we need to rely on hypothesis testing in relation to determining the relationship between the response and predictor variables. In the case of the linear regression model, two types of hypothesis testing are done. They are T-tests and F-tests. In other words, there are two types of statistics that are used to assess whether linear regression models exist representing response and predictor variables. They are …
Correlation Concepts, Matrix & Heatmap using Seaborn
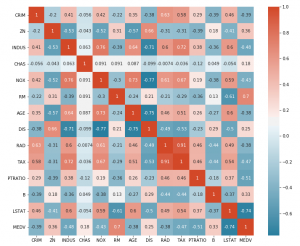
In this blog post, we’ll be discussing correlation concepts, matrix & heatmap using Seaborn. For those of you who aren’t familiar with Seaborn, it’s a library for data visualization in Python. So if you’re looking to up your data visualization game, stay tuned! We’ll start with the basics of correlation and move on to discuss how to create matrices and heatmaps with Seaborn. Let’s get started! Introduction to Correlation Correlation is a statistical measure that expresses the strength of the relationship between two variables. The two main types of correlation are positive and negative. Positive correlation occurs when two variables move in the same direction; as one increases, so do …
When to Use Which Clustering Algorithms?
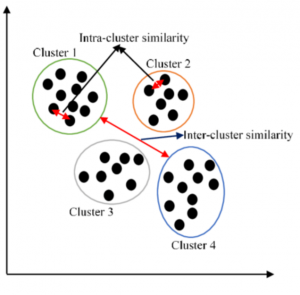
There are many clustering machine learning algorithms to choose from when you want to cluster data. But which one should you use in a particular situation? In this blog post, we will explore the different clustering algorithms and explain when each one is most appropriate. We will also provide examples so that you can see how these algorithms work in practice. What clustering is and why it’s useful Simply speaking, clustering is a technique used in machine learning to group data points together. The goal of clustering is to find natural groups, or clusters, in the data. Clustering algorithms are used to automatically find these groups. Clustering is useful because …
AI / Data Science Operating Model: Teams, Processes
Realizing value from AI/data science or machine learning projects requires the coordination of many different teams based on an appropriate operating model. If you want to build an effective AI/data science operation, you need to create a data science operating model that outlines the steps involved in how teams are structured, how data science projects are implemented, how the maturity of data science practice is evaluated and an overall governance model which is used to keep a track of data science initiatives. In this blog post, we will discuss the key components of a data science operating model and provide examples of how to optimize your data science process. AI …
Deductive & Inductive Reasoning: Examples, Differences
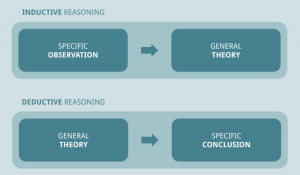
When it comes to data science, there are two main types of reasoning that you need to be familiar with: deductive and inductive. Both of these techniques are important in order to make sound decisions based on the data that you’re working with. In this blog post, we’ll take a closer look at what deductive and inductive reasoning are, what are their differences, and how they’re related to each other. What is deductive reasoning? Deductive reasoning is an important tool in data science. Deductive reasoning is the process of deriving a conclusion based on premises that are known or assumed to be true. In other words, deductive reasoning allows you …

I found it very helpful. However the differences are not too understandable for me