There are many clustering machine learning algorithms to choose from when you want to cluster data. But which one should you use in a particular situation? In this blog post, we will explore the different clustering algorithms and explain when each one is most appropriate. We will also provide examples so that you can see how these algorithms work in practice.
What clustering is and why it’s useful
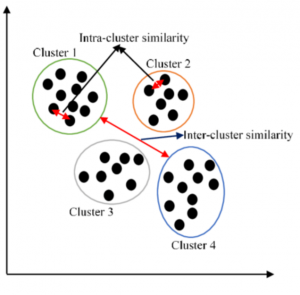
Simply speaking, clustering is a technique used in machine learning to group data points together. The goal of clustering is to find natural groups, or clusters, in the data. Clustering algorithms are used to automatically find these groups. Clustering is useful because it can help to find problems in the data, such as outliers. It can also be used to improve the accuracy of machine learning models by providing more information about the structure of the data. In addition, clustering can be used to compress data, which can speed up training time for machine learning models. overall, clustering is a valuable tool that can be used to understand and improve machine learning models.
There are many different clustering algorithms, each with its own strengths and weaknesses. The right algorithm for a particular dataset depends on the nature of the data and the clustering goals. In general, however, clustering can be useful for tasks such as identifying customer segments, finding groups of similar items, and reducing the dimensionality of data.
Common clustering algorithms
There are a variety of clustering algorithms, but some of the most common include k-means clustering, hierarchical clustering, and density-based clustering. K-means clustering works by dividing data into a specified number of groups, or clusters. Each data point is then assigned to the nearest cluster. Hierarchical clustering, on the other hand, does not require the number of clusters to be specified in advance. Instead, it builds a hierarchy of clusters, with each cluster containing data points that are similar to each other. Some of the commonly used algorithms for hierarchical clustering include agglomerative clustering and divisive clustering. Density-based clustering groups data points together that are close to each other in space. This type of clustering is often used for anomaly detection, as it can be used to identify points that are far from the rest of the data. Some of the commonly used algorithms for density-based clustering include DBSCAN and OPTICS. There are many other clustering algorithms, but these are two of the most commonly used.
When to use different clustering algorithms?
The following represents different use case scenarios and which clustering algorithm can one get started with:
- An ordered set of clusters with variable precision: If there is a need to have an ordered set of clusters with variable precision then one can use hierarchical clustering. Hierarchical clustering is a top-down approach that starts with all data points in a single cluster and then iteratively splits the clusters until there is only one data point per cluster. It creates a tree-like structure of clusters, where each cluster is a subset of the next larger cluster. This approach is well suited for problems where the number of clusters is unknown, as the algorithm will continue to create new clusters until all data points are grouped. Additionally, hierarchical clustering can handle both numerical and categorical data, making it a versatile tool for many different applications. This approach has the advantage of being very fast and scalable, but it can be sensitive to outliers and noise in the data. The following are a few examples of an ordered set of clusters:
- Different stages in a biological process where each stage can be more or less precise.
- Different grades of products where each grade is a cluster.
- Clustering sensor readings on a factory floor where each machine is a cluster.
- Clustering genes according to their functions where each function is a cluster.
- An unknown number of clusters: When there are unknown clusters, you can get started with X-means or the Canopy algorithm. The x-means algorithm is an improvement over the K-means clustering algorithm. X-means clustering algorithm is a clustering algorithm that is used to partition data into clusters. The algorithm works by iteratively splitting each cluster into two until a desired number of clusters is reached. X-means clustering is often used when the number of desired clusters is not known in advance. The Canopy clustering algorithm can be used to pre-cluster data points so that other clustering algorithms can be run on them. This can improve the accuracy of clustering and make it faster. The following are examples of unknown clusters:
- Clustering customers according to their spending habits.
- Clustering images of animals according to their species.
- Clustering text data: When there are instances of text such as documents to be clustered, you can go about techniques such as topic modeling. Topic modeling is a statistical technique for discovering the structure of the latent topics in a collection of documents. Topic models are a type of unsupervised learning, which means that they require no labeled data. Instead, Topic models automatically learn the structure of the documents by looking at word patterns. There are many different algorithms for Topic modeling, but they all share a common goal: to find the hidden themes in a dataset. There are various algorithms that can be used for topic modeling, including Latent Dirichlet Allocation (LDA), Non-Negative Matrix Factorization (NMF), and Hierarchical Dirichlet Process (HDP). Each algorithm has its own advantages and disadvantages, so it is important to choose the right algorithm for the specific data set and application. One popular topic modeling algorithm is Latent Dirichlet Allocation (LDA). LDA is a generative model that estimates the probability of each word in each document, given the topic. LDA can be used to find the underlying topics in a collection of documents, and it is often used for text classification. The following are examples of clustering text data:
- Clustering news articles by their topic.
- Clustering customer reviews by the product they are reviewing.
- Clustering blog posts by their topic
- Non-elliptical cluster: Non-elliptical clusters are groups of data points that are not well-represented by an elliptical shape. In other words, they are irregularly shaped clusters that cannot be easily fit into a standard mathematical model. This can often be due to the presence of outliers or noise in the data set. Non-elliptical clusters are not constrained by the assumption that points in a cluster must be close to one another along with all dimensions. Non-elliptical clusters can have any shape, and as such, they can more accurately reflect the true underlying structure of the data. Non-elliptical clusters can be more difficult to detect than elliptical ones, as traditional clustering algorithms often assume an underlying elliptical structure. However, there are a number of specialized algorithms that are designed to identify non-elliptical clusters. These algorithms can be used to uncover hidden patterns and structures in data sets that would otherwise go undetected. Real-world examples of non-elliptical clusters include clusters that are of different densities or clusters that have a non-uniform shape. Some clustering algorithms such as K-means clustering, expect the clusters to be of a uniform density and spherical in shape. This means that they will not work well on data sets that have non-elliptical clusters. In this case, one can use clustering algorithms such as Affinity Propagation, Fractal, or DBSCAN. DBSCAN Algorithm is a density-based clustering algorithm that is used to find clusters of data points that are close to each other in space. The fractal algorithm is defined as a clustering algorithm that generates fractal-like clusters. The following are examples of non-elliptical clusters:
- Clustering images of animals according to their shape.
- Clustering data that contains a lot of noise.
- Clustering stars in a galaxy according to their position.
- Clustering people at a party according to their location.
- High dimensional data: High-dimensional data is data that has many variables or features. This type of data is often found in scientific and research applications, where there are many different factors that can affect the outcome of an experiment. High-dimensional data can be difficult to analyze because traditional statistical methods are not designed to deal with such a large number of variables. However, recent advances in machine learning have made it possible to develop algorithms that can effectively handle high-dimensional data. The high number of variables allows the model to learn more complex relationships. In statistics, high-dimensional data is often used to study rare events. The high number of variables makes it possible to detect patterns that would be difficult to see with fewer variables. High-dimensional data can be challenging to work with, but it can also provide insights that would be otherwise unavailable. While working with high-dimensional data, one can use clustering algorithms such as k-means++ or DenStream. K-means++ algorithm is defined as an improvement over the k-means clustering algorithm. The following are examples of high dimensional data:
- Clustering customers according to their spending habits across a large number of products.
- Clustering images of animals according to their shape and color.
- Data with mixed types of features: Data that has a mix of categorical and numerical features can use clustering algorithms such as k-modes or k-prototypes. K-modes clustering algorithm is used for clustering data that contains a mix of categorical and numerical features. The k-prototypes clustering algorithm is an extension of the k-modes clustering algorithm that can also handle numerical data. The following are examples of data with mixed types of features:
- Clustering customers according to their spending habits across a mix of categorical (e.g. type of product) and numerical (e.g. amount spent) features.
- Clustering images of animals according to their shape, color, and size.
- Data that is not linearly separable: Data that is not linearly separable can use clustering algorithms such as Gaussian Mixture Model or Birch. The following are examples of data that is not linearly separable:
- Clustering data that contains a lot of outliers.
- Clustering data that is generated from a non-linear process.
- Soft memberships in cluster: When there are data points that can belong to more than one cluster with a certain degree of probability, clustering algorithms such as Gaussian mixture models, Fuzzy C-Means, or possibilistic C-Means can be used. The following are examples of data that has soft memberships in clusters:
- Clustering customers according to their spending habits where each customer can belong to multiple clusters with a certain degree of probability.
- Clustering images of animals according to their shape, color, and size where each image can belong to multiple clusters with a certain degree of probability.
- Data that is in the form of a graph: Data that is in the form of a graph can use clustering algorithms such as Markov clustering or community detection algorithms. The following are examples of data that is in the form of a graph:
- Clustering social media users according to their interests.
- Clustering web pages according to their content.

Check out my latest book titled as First Principles Thinking: Building winning products using first principles thinking.
- Mathematics Topics for Machine Learning Beginners - July 6, 2025
- Questions to Ask When Thinking Like a Product Leader - July 3, 2025
- Three Approaches to Creating AI Agents: Code Examples - June 27, 2025
I found it very helpful. However the differences are not too understandable for me