Category Archives: Python
Feature Importance & Random Forest – Sklearn Python Example
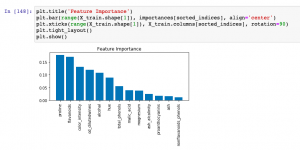
Last updated: 9th Dec, 2023 When building machine learning classification and regression models, understanding which features most significantly impact your model’s predictions can be as crucial as the predictions themselves. This post delves into the concept of feature importance in the context of one of the most popular algorithms available – the Random Forest. Whether used for classification or regression tasks, Random Forest not only offers robust and accurate predictions but also provides insightful metrics to find the most important features in your dataset. You will learn about how to use Random Forest regression and classification algorithms for determining feature importance using Sklearn Python code example. It is very important to …
Random Forest vs AdaBoost: Difference, Python Example
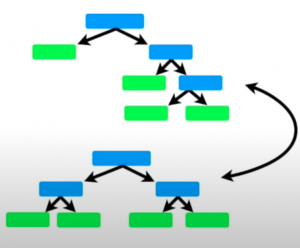
Last updated: 8th Dec, 2023 In this post, you will learn about the key differences between the AdaBoost and the Random Forest machine learning algorithm. Random Forest and AdaBoost algorithms can be used for both regression and classification problems. Both the algorithms are ensemble learning algorithms that construct a collection of trees for prediction. Random Forest builds multiple decision trees using diverse variables and employs bagging for data sampling and predictions. AdaBoost, on the other hand, creates an ensemble of weak learners, often in the form of decision stumps (simple trees with one node and two leaves). AdaBoost iteratively adjusts these stumps to concentrate on mispredicted areas, often leading to higher …
Decoding Bagging in Random Forest: Examples

This blog provides an overview of how bagging, or bootstrap aggregating, improves the effectiveness of Random Forest machine learning models. You will learn about the process of creating multiple data subsets through bootstrap sampling, building individual decision trees for each subset, and how this diversity among trees reduces overfitting, leading to more accurate and robust random forest models. The post also explains how the aggregation of predictions from these trees ensures a balanced and less biased overall model. You also get to learn based on Python code example. What is Bagging? Before we delve into Random Forest, it’s crucial to understand the concept of bagging. Bagging is a general ensemble …
Logistic Regression Customer Churn Prediction: Example

In today’s fast-paced and highly competitive business world, spanning across industries like telecommunications, finance, e-commerce, and more, the ability to predict and understand customer churn has emerged as a critical component of strategic business management. Whether it’s a telecom giant grappling with subscriber turnover, a fintech company aiming to retain its user base, or an e-commerce platform trying to reduce shopping cart abandonment, the implications of churn are vast and deeply impactful. This is where the role of logistic regression, a potent and versatile statistical method, comes into play. This blog delves into different aspects of training a logistic regression machine learning model for churn prediction, highlighting its universality and …
GLM vs Linear Regression: Difference, Examples

Linear Regression and Generalized Linear Models (GLM) are both statistical methods used for understanding the relationship between variables. Understanding the difference between GLM and Linear Regression is essential for accurate model selection, tailored to data types and research questions. It’s crucial for predicting diverse outcomes, ensuring valid statistical inference, and is vital in interdisciplinary research. In this blog, we will learn about the differences between Linear Regression and GLM by delving into their distinct characteristics, suitable applications, and the importance of choosing the right model based on data type and research objective. What’s the difference between GLM & Linear Regression? Linear Regression and Generalized Linear Models (GLM) are two closely …
MinMaxScaler vs StandardScaler – Python Examples
Last updated: 7th Dec, 2023 Feature scaling is an essential part of exploratory data analysis (EDA), when working with machine learning models. Feature scaling helps to standardize the range of features and ensure that each feature (continuous variable) contributes equally to the analysis. Two popular feature scaling techniques used in Python are MinMaxScaler and StandardScaler. In this blog, we will learn about the concepts and differences between these feature scaling techniques with the help of Python code examples, highlight their advantages and disadvantages, and provide guidance on when to use MinMaxScaler vs StandardScaler. Note that these are classes provided by sklearn.preprocessing module. As a data scientist, you will need to …
Using GridSearchCV with Logistic Regression Models: Examples

GridSearchCV method is a one of the popular technique for optimizing logistic regression models, automating the search for the best hyperparameters like regularization strength and type. It enhances model performance by incorporating cross-validation, ensuring robustness and generalizability to new data. This method saves time and ensures objective model selection, making it an essential technique in various domains where logistic regression is applied. Its integration with the scikit-learn library (sklearn.model_selection.GridSearchCV) simplifies its use in existing data pipelines, making it a valuable asset for both novice and experienced machine learning practitioners. How is GridSearchCV used with Logistic Regression? GridSearchCV is a technique used in machine learning for hyperparameter tuning. It is a …
Handling Class Imbalance in Machine Learning: Python Example
Techniques for Handling Class Imbalance Class imbalance may not always impact performance, and using imbalance-specific methods can sometimes worsen results. Xu-Ying Liu, Jianxin Wu, and Zhi-Hua Zhou, Exploratory Undersampling for Class-Imbalance Learning Above said, there are different techniques such as the following for handling class imbalance when training machine learning models with datasets having imbalanced classes. Python packages such as Imbalanced Learn can be used to apply techniques related to under-sampling majority classes, upsampling minority classes, and SMOTE. In this post, techniques related to using class weight will be used for tackling class imbalance. How to create a Sample Dataset having Class Imbalance? In this section, you will learn about how to create an …
Handling Class Imbalance using Sklearn Resample
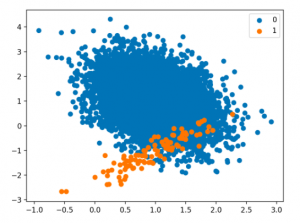
Last updated: 5th Dec, 2023 The class imbalance problem in machine learning occurs when the classes in a dataset are not represented equally, leading to a significant difference in the number of instances for different classes. This imbalance can cause a classification model to be biased towards the majority class, resulting in poor performance on the minority class. Thus, the class imbalance hinders data scientists by challenging the development of accurate and fair models, as the skewed distribution can lead to misleading training predictions / outcomes and reduced effectiveness in real-world applications where minority classes are critical. In this post, you will learn about how to tackle class imbalance issue …
Linear Regression Cost Function: Python Example

Linear regression is a foundational algorithm in machine learning and statistics, used for predicting numerical values based on input data. Understanding the cost function in linear regression is crucial for grasping how these models are trained and optimized. In this blog, we will understand different aspects of cost function used in linear regression including how it does help in building a regression model having high performance. What is a Cost Function in Linear Regression? In linear regression, the cost function quantifies the error between predicted values and actual data points. It is a measure of how far off a linear model’s predictions are from the actual values. The most commonly …
KNN vs Logistic Regression: Differences, Examples
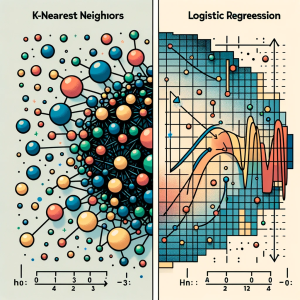
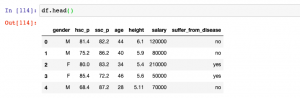
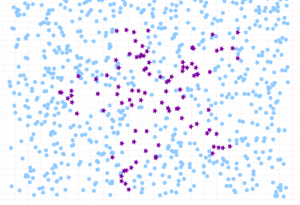
In this blog, we will learn about the differences between K-Nearest Neighbors (KNN) and Logistic Regression, two pivotal algorithms in machine learning, with the help of examples. The goal is to understand the intricacies of KNN’s instance-based learning and Logistic Regression‘s probability modeling for binary and multinomial outcomes, offering clarity on their core principles. We will also navigate through the practical applications of K-NN and logistic regression algorithms, showcasing real-world examples in various business domains like healthcare and finance. Accompanying this, we’ll provide concise Python code samples, guiding you through implementing these algorithms with datasets. This dual focus on theory and practicality aims to equip you with both the understanding …
Python – How to Create Scatter Plot with IRIS Dataset

Last updated: 1st Dec, 2023 In this blog post, we will be learning how to create a Scatter Plot with the IRIS dataset using Python. The IRIS dataset is a collection of data that is used to demonstrate the properties of various statistical models. It contains information about 50 observations on four different variables: Petal Length, Petal Width, Sepal Length, and Sepal Width. As data scientists, it is important for us to be able to visualize the data that we are working with. Scatter plots are a great way to do this because they show the relationship between two variables. In this post, we learn how to plot IRIS dataset …
AIC in Logistic Regression: Formula, Example

Have you as a data scientist ever been challenged by choosing the best logistic regression model for your data? As we all know, the difference between a good and the best model while training machine learning model can be subtle yet impactful. Whether it’s predicting the likelihood of an event occurring or classifying data into distinct categories, logistic regression provides a robust framework for analysts and researchers. However, the true power of logistic regression is harnessed not just by building models, but also by selecting the right model. This is where the Akaike Information Criterion (AIC) comes into play. In this blog, we’ll delve into different aspects of AIC, decode …
Learning Curves Python Sklearn Example
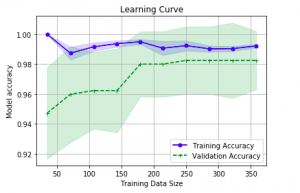
Last updated: 26th Nov, 2023 In this post, you will learn about how to use learning curves to assess the improvement in learning performance (accuracy, error rate, etc.) of a machine learning model while implementing using Python (Sklearn) packages. Knowing how to use learning curves will help you assess/diagnose whether the model is suffering from high bias (underfitting) or high variance (overfitting) and whether increasing training data samples could help solve the bias or variance problem. You may want to check some of the following posts in order to get a better understanding of bias-variance and underfitting-overfitting. Bias-variance concepts and interview questions Overfitting/Underfitting concepts and interview questions What are learning curves? …
XGBoost Classifier Explained with Python Example
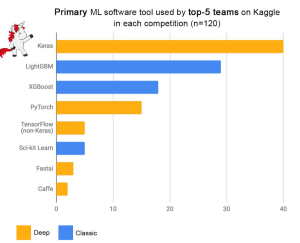
Among the myriad of machine learning algorithms and techniques available with data scientists, one stands out for its exceptional performance in classification problems: XGBoost, short for eXtreme Gradient Boosting. This algorithm has established itself as a force to reckon with in the data science community, as evidenced by its frequent use and high placements in Kaggle competitions, a platform where data scientists and machine learning practitioners worldwide compete to solve complex data problems. The following plot is taken from Francois Chollet tweet. Above demonstrates the prominence of XGBoost as one of the primary machine learning software tools used by the top-5 teams across 120 Kaggle competitions. The data points in …
Bagging Classifier Python Code Example
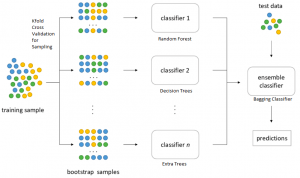
Last updated: 25th Nov, 2023 Bagging is a type of an ensemble machine learning approach that combines the outputs from many learner to improve performance. The bagging algorithm works by dividing the training set into smaller subsets. These subsets are then processed through different machine-learning models. After processing, the predictions from each model are combined. This combination of predictions is used to generate an overall prediction for each instance in the original data. In this blog post, you will learn about the concept of Bagging along with Bagging Classifier Python code example. Bagging can be used in machine learning for both classification and regression problem. The bagging classifier technique is utilized across a …
I found it very helpful. However the differences are not too understandable for me