Tag Archives: Data Science
Steps for Evaluating & Validating Time-Series Models
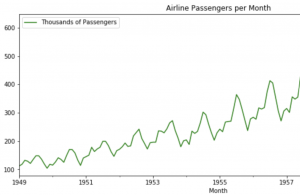
Time-series machine learning models are becoming increasingly popular due to the large volume of data that is now available. These models can be used to make predictions about future events, and they are often more accurate than traditional methods. However, it is important to properly evaluate (check accuracy by performing error analysis) and validate these models before you put them into production. In this blog post, we will discuss the different ways that you can evaluate and validate time series machine learning models. We will also provide some tips on how to improve your results. As data scientists, it is important to learn the techniques related to evaluating time-series models. …
Machine Learning with Alteryx: Examples
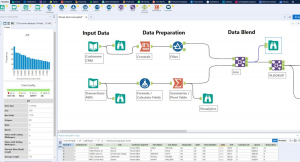
Alteryx is a self-service data analytics software platform that enables users to easily prep, blend, and analyze data all in one place. It is a powerful tool that can be used in a variety of machine learning scenarios. It can be used to clean and prepare data, and develop, evaluate and deploy machine learning (ML) models. It offers a variety of features and tools that can be used to preprocess data, choose algorithms, train models, and evaluate results. In this blog post, we will discuss some of the ways that Alteryx can be used in machine learning. We will also provide examples of how to use Alteryx in machine learning scenarios. …
Business Analytics Team Structure: Roles/ Responsibilities
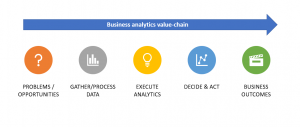
Business analytics is a business function that has been around for years, but it’s only recently gained traction as one of the most important business functions. Organizations are now realizing how business analytics can help them increase revenue and improve business operations. But before you bring on a business analytics team, you need to determine if your company needs full-time or part-time team members or both. It might seem logical to hire full-time staff members just because they’re in demand, but this isn’t always necessary. If your business operates without any external data sets and doesn’t have complex reporting and advanced analytics needs then it may be more cost-effective to …
Linear Regression Interview Questions for Data Scientists
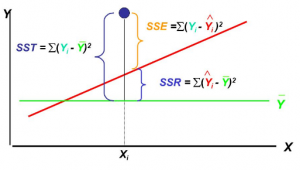
This page lists down 40 regression (linear/univariate, multiple/multilinear/multivariate) interview questions (in form of objective questions) which may prove to be helpful for Data Scientists / Machine Learning enthusiasts. Those appearing for interviews for machine learning/data scientist freshers/intern/beginners positions would also find these questions very helpful and handy enough to quickly brush up / check your knowledge and prepare accordingly. Practice Tests on Regression Analysis These interview questions are split into four different practice tests with questions and answers which can be found on following page: Linear, Multiple regression interview questions and answers – Set 1 Linear, Multiple regression interview questions and answers – Set 2 Linear, Multiple regression interview questions …
Most In-Demand Skills for Data Scientists in 2022
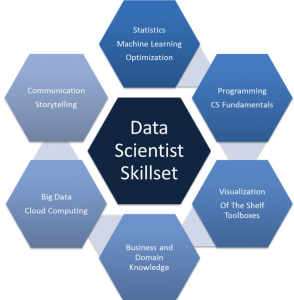
The data science field is growing rapidly and data scientists are in high demand. If you want to enter this field, it’s important that you have the right skills. In this blog post, we’ll explore the most in-demand skills of data scientist employers are looking for the most and how to develop these skills so that you can find a job as a data scientist. Strong knowledge and experience with Statistical/ML methods: Strong familiarity with statistical concepts such as probability distributions (e.g., normal distribution), concepts of hypothesis testing, regression analysis, etc is essential for becoming a great data scientist. One of the most important ask for a data scientist is …
One-sample Z-test for Means: Formula & Examples
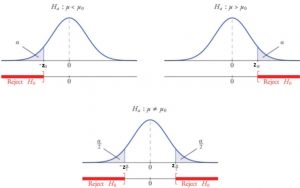
One sample Z-test for means is one of the statistical techniques used for testing hypothesis related to whether the sample belongs to a population. As a data scientist, you must get a good understanding of the z-test and its applications to test the hypothesis for your statistical models. In this blog post, we will discuss the one sample z-test for means and its concepts with an example. You may want to check my post on hypothesis testing titled – Hypothesis testing explained with examples What is One-sample Z-test for Means? Z-test is usually referred to as a 1-sample Z-test for means that is used to test the hypothesis about the …
Z-tests for Hypothesis testing: Formula & Examples
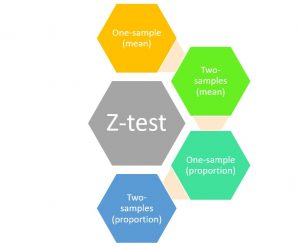
Z-tests are statistical hypothesis testing techniques that are used to determine whether the null hypothesis relating to comparing sample means or proportions with that of population at a given significance level can be rejected or otherwise based on the z-statistics or z-score. As a data scientist, you must get a good understanding of the z-tests and its applications to test the hypothesis for your statistical models. In this blog post, we will discuss an overview of different types of z-tests and related concepts with the help of examples. You may want to check my post on hypothesis testing titled – Hypothesis testing explained with examples What are Z-tests & Z-statistics? …
One sample Z-test for proportion: Formula & Examples
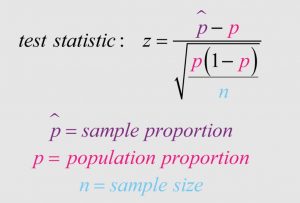
One proportion z-test or one-sample Z-test for proportion is one of the most popular statistical hypothesis tests dealing with one sample proportion. It is used to determine whether or not a hypothesized mean difference between the sample and the population can be rejected by drawing conclusions from sample data. As a data scientist, it is important to be proficient in this type of Z-test and understand how it works. In this blog post, we will learn about how one proportion z-test works with the help of formula and examples. What is one sample Z-test for proportion? A one proportion Z-test is a hypothesis testing technique which is used for testing …
Z-test MCQs with Answers: Interview Questions
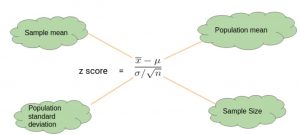
In this blog post, you can test your knowledge about Z-test, Z-statistics and related concepts through multiple choice questions (MCQs) and answers. Getting a good understanding of Z-tests, Z-statistics and Z-distribution is of utmost importance for data scientists at large. The following are key concepts around which the MCQs are posted: Z-score or Z-statistics concepts Estimation of population mean and proportion 1-sample Z-test for mean and proportion 2-samples Z-test for mean and proportion Z-test Interview Questions Samples The following is a list of interview questions that you would want to learn: What is Z-score? Explain with an example and formula. What are different types of Z-tests? Explain with formula and …
Z-Score Explained with Ronaldo / Robert Example

In this post, you will learn the concepts of Z-Score with the help from examples including Christiano Ronaldo and Robert Lewandowski. You will learn about how to compare and call out whose performance was better in Champions League 2019-2020. As a data scientist, it will be extremely important to learn the concepts of Z-Scores, also called as Standard scores, as it would help you evaluate / compare a particular data set with past data set. Before getting into the example of Z-scores, lets understand some concepts of Z-scores. What’s Z-Score or Z-statistics? Z-score can be defined as number of standard deviations the data point is above or below the mean …
Different Success / Evaluation Metrics for AI / ML Products

In this post, you will learn about some of the common success metrics that can be used for measuring the success of AI / ML (machine learning) / DS (data science) initiatives / projects / products. If you are one of the AI / ML stakeholders including product managers, you would want to get hold of these metrics in order to apply right metrics in right business use cases. Business leaders do want to know and maximise the return on investments (ROI) from AI / ML investments. Here is the list of success metrics for AI / DS / ML initiatives: Business value metrics / key performance indicators (KPIs): Business …
Null and Alternate hypothesis: Definition & Example
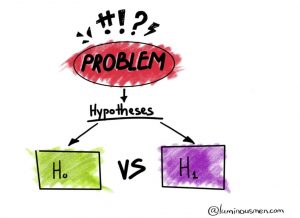
Hypothesis testing is a technique used to determine whether an assumption about the population is true. Null hypothesis and alternate hypothesis are two types of hypotheses that you may hear when conducting this type of test. Having a good understanding about null and alternate hypothesis will help you better design good hypothesis tests and understand their results in a nice manner. It is very important for data scientists to be able to distinguish between null and alternate hypothesis and design hypothesis tests. In this blog post, we will understand the definition and examples of the null and alternate hypothesis. What are different scenarios for hypothesis testing? The following are two …
Normal Distributions Questions and Answers for Interviews
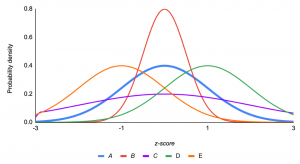
In order to be successful in normal distribution interviews, you need a solid understanding of the normal distribution. This blog post will focus on normal distribution questions and answers that are commonly asked in the data science and statistics interviews. Before jumping into questions and answers, lets quickly understand what normal distribution is. What is normal distribution? A normal distribution is a symmetric, bell-shaped curve that describes the distribution of many types of data. The normal distribution has two parameters, mean and standard deviation. It is important to know these two parameters because they are used to calculate probabilities associated with the normal distribution. The normal curve describes how data …
Level of Significance & Hypothesis Testing
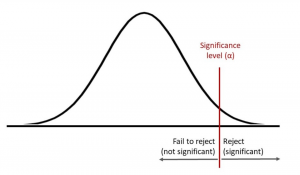
In hypothesis testing, the level of significance is a measure of how confident you can be about rejecting the null hypothesis. This blog post will explore what hypothesis testing is and why understanding significance levels are important for your data science projects. In addition, you will also get to test your knowledge of level of significance towards the end of the blog with the help of quiz. These questions can help you test your understanding and prepare for data science / statistics interviews. Before we look into what level of significance is, let’s quickly understand what is hypothesis testing. What is Hypothesis testing and how is it related to significance …
P-Value & Hypothesis Testing: Examples
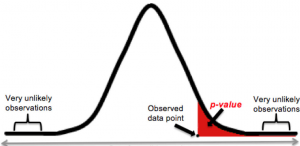
Many describe p-value as the probability that the null hypothesis holds good. That is an incorrect definition. The concept of p-value is understood differently by different people and is considered as one of the most used & abused concepts in statistics, mostly in relation to hypothesis testing. In this blog post, you will learn the P-VALUE concepts with multiple different examples. It is extremely important to get a good understanding of P-value if you are starting to learn data science/machine learning as the concepts of P-value are key to hypothesis testing. Before getting into the description of p-value, let’s quickly go through the hypothesis testing concepts to get a good …
Type I & Type II Errors in Hypothesis Testing: Examples

This article describes Type I and Type II errors made due to incorrect evaluation of the outcome of hypothesis testing, based on a couple of examples such as the person comitting a crime, the house on fire, and Covid-19. You may want to note that it is key to understand type I and type II errors as these concepts will show up when we are evaluating a hypothesis such as those related to machine learning algorithms (linear regression, logistic regression, etc). For example, in the case of linear regression models, the significance value is compared with the p-value and, the null hypothesis that the parameter/coefficient is equal to zero is …

I found it very helpful. However the differences are not too understandable for me