This page lists down 40 regression (linear/univariate, multiple/multilinear/multivariate) interview questions (in form of objective questions) which may prove to be helpful for Data Scientists / Machine Learning enthusiasts. Those appearing for interviews for machine learning/data scientist freshers/intern/beginners positions would also find these questions very helpful and handy enough to quickly brush up / check your knowledge and prepare accordingly.
Practice Tests on Regression Analysis
These interview questions are split into four different practice tests with questions and answers which can be found on following page:
- Linear, Multiple regression interview questions and answers – Set 1
- Linear, Multiple regression interview questions and answers – Set 2
- Linear, Multiple regression interview questions and answers – Set 3
- Linear, Multiple regression interview questions and answers – Set 4
Regression Topics covered in these Practice Tests
Some of the following topics have been covered in these questions and answers:
- Introduction to linear (univariate) and multi-linear / multiple (multivariate) regression
- Concepts related with the coefficient of determination vis-a-vis Pearson correlation coefficient
- Evaluation of regression models using different techniques such as t-tests, analysis of variance f-tests
- Sum of squares calculations and related concepts
- Concepts related with R-squared, adjusted R-squared
Linear / Multi-linear Regression Questions and Answers
- In simple linear regression, there is _______ dependent variable and ________ independent variable(s)
- One, multiple
- Multiple, one
- One, one
- Multiple, multiple
- In multi-linear regression, there is _______ dependent variable and ________ independent variable(s)
- Multiple, one
- One, multiple
- Multiple, multiple
- One, one
- It is OK to add independent variables to a multi-linear regression model as it increases the explained variance of the model and makes the model more efficient
- True
- False
- Linear or multilinear regression helps in predicting _______
- Continuous valued output
- Discrete valued output
- Linear regression analysis helps in studying __________ relationship between variables.
- Deterministic
- Statistical
- Linear regression analysis helps in doing which of the following?
- Causal analysis
- Effects in forecasting
- Forecasting trends
- All of the above
- The best fit line is achieved by finding values of the parameters which minimizes the sum of __________
- Sum of squared regression (SSR)
- Sum of squared residuals/errors (SSE)
- Sum of squares total (SST)
- Best fit line is also termed as _______
- Maximum squares regression line
- Least squares regression line
- Which of the following can be used to understand the statistical relationship between dependent and independent variables in linear regression?
- Coefficient of determination
- Correlation coefficient
- Both of the above
- None of the above
- It is absolutely OK to state that correlation does imply causation
- True
- False
- The value of coefficient of determination, R-squared, is _________
- Less than 0
- Greater than 1
- Between 0 and 1
- Which of the following can be used to understand the positive or negative relationship between dependent and independent variables
- Coefficient of determination
- Pearson correlation coefficient
- Both of the above
- None of the above
- The goal of the regression model is to achieve the R-squared value ________
- Closer to 0
- Closer to 1
- More than 1
- Less than 1
- Pearson correlation coefficient does always have a positive value
- True
- False
- Value of Pearson correlation coefficient near to zero represents the fact there is a stronger relationship between dependent and independent variables
- True
- False
- Population correlation coefficient and sample correlation coefficient are one and the same
- True
- False
- The value of the Pearson correlation coefficient falls in the range of _________
- 0 and 1
- 0 and -1
- -1 and 1
- 1 and 2
- The large value of R-squared can be safely interpreted as the fact that the estimated regression line fits the data well.
- True
- False
- The value of R-squared does not depend upon the data points; Rather it only depends upon the value of parameters
- True
- False
- The value of correlation coefficient and coefficient of determination is used to study the strength of the relationship in ________
- Samples only
- Both Samples and Population
- Population only
- Which of the following tests can be used to determine whether a linear association exists between the dependent and independent variables in a simple linear regression model?
- T-test
- ANOVA F-test
- Both of the above
- None of the above
- In order to estimate population parameter, the null hypothesis is that the population parameter is ________ to zero?
- Equal
- Not equal
- Which of the following can be used for learning the value of parameters for the regression model for population and not just the samples?
- Hypothesis testing
- Confidence intervals
- Both of the above
- None of the above
- The value of R-Squared _________ with the addition of every new independent variable?
- May increase or decrease
- Always increases
- Always decreases
- In order to reject the null hypothesis while estimating the population parameter, p-value has to be _______ given 0.05 is set as significance level
- More than 0.05
- Less than 0.05
- The value of ____________ may increase or decrease based on whether a predictor variable enhances the model or not
- R-squared
- Adjusted R-squared
- The value of Adjusted R-squared _________ if the predictor variable enhances the model less than what is predicted by chance?
- Increases
- Decreases
- In regression model t-tests, the value of t-test statistics is equal to ___________?
- Coefficient divided by Standard error of the coefficient
- Standard error of coefficient divided by coefficient
- Coefficient plus standard error of the coefficient
- In ANOVA test for regression, degrees of freedom (regression) is _________
- Equal to the number of parameters being estimated
- One more than the number of parameters being estimated
- One less than the number of parameters being estimated
- In ANOVA test for regression, degrees of freedom (regression) is _________
- Equal to the number of predictor variables
- One more than the number of predictor variables
- One less than the number of predictor variables
- For SST as the sum of squares total, SSE as the sum of squared errors, and SSR as the sum of squares regression, which of the following is correct?
- SST = SSR – SSE
- SST = SSR + SSE
- SST = SSR/SSE
- The value of coefficient of determination is which of the following?
- SSR / SST
- SSE / SST
- Mean squared error can be calculated as _______
- Sum of squares residuals or error/degrees of freedom
- Sum of squares regression/ degrees of freedom
- Sum of squares total/ degrees of freedom
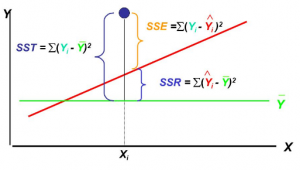
- Sum of Squares Regression (SSR) is ________
- Sum of Squares of predicted value minus the average value of the dependent variable
- Sum of Squares of Actual value minus predicted value
- Sum of Squares of Actual value minus the average value of the dependent variable
- Sum of Squares Error (SSE) is ________
- Sum of Squares of predicted value minus the average value of the dependent variable
- Sum of Squares of Actual value minus predicted value
- Sum of Squares of Actual value minus the average value of the dependent variable
- Sum of Squares Total (SST) is ________
- Sum of Squares of predicted value minus the average value of the dependent variable
- Sum of Squares of Actual value minus predicted value
- Sum of Squares of Actual value minus the average value of the dependent variable
- ______ the value of the sum of squares regression (SSR), better the regression model
- Greater
- Lesser
- The objective for regression model is to minimize ______ and maximize ______
- SSR, SSE
- SSE, SSR
- SSR, SST
- SSE, SST
- Which of the following can be used to test the hypothesis that there exists a linear regression model with at least one predictor variable?
- F-test
- T-test
- Which of the following is the ratio of explained variance and unexplained variance in relation to doing hypothesis testing with regression model?
- T-statistics
- F-statistics
Hope you would find the above set of questions along with practice tests related to linear/multiple regression useful for next/upcoming interviews in relation to the data scientist/machine learning engineer position.
In case, you want to get a hold of a PDF file listing down questions and answers, here is the document: Linear regression interview questions and answers (PDF).
References
Here are some of my other posts in relation to linear regression:
- Building linear regression models
- Linear regression explained with python examples: The concepts such as residual error, SSE (Sum of squares residual error), SSR (Sum of Squares Regression), SST (Sum of Squares Total), R-Squared, etc have been discussed with diagrams. A linear regression model is trained with Sklearn Boston housing data set using Sklearn.linear_model LinearRegression implementation
- Assessing regression model performance
- R-squared in linear regression – Concepts, Examples: This blog describes the concepts of R-squared which is a metric used for assessing the performance of linear regression model. R-squared represents the fraction of variance explained by the regression model.
- R-squared vs Adjusted R-squared – Differences, Examples: This blog describes the concepts of R-squared and adjusted R-squared along with the differences and why you should choose one over the other.
- Mean Squared Error (MSE) or R-Squared: Which one to use?: Linear regression model performance metrics such as MSE and R-Squared with Python code examples have been discussed.
- Linear regression & hypothesis testing
- Linear regression hypothesis testing example: This blog post explains concepts in relation to how T-tests and F-tests are used to test different hypotheses in relation to the linear regression model. T-tests are used to test whether there is a relationship between response and individual predictor variables. F-test is used to test whether there exists a linear regression model representing the problem statement.
- Linear regression & T-test: The blog post explains the concepts in relation to how T-tests are used to test the hypotheses related to the relationship between response and predictor variables.
- How to interpret F-statistics in linear regression model: This blog explains the concepts of F-statistics and how they can be used to test the hypothesis of whether there exists a linear regression comprising of predictor variables.

Check out my latest book titled as First Principles Thinking: Building winning products using first principles thinking.
- Mathematics Topics for Machine Learning Beginners - July 6, 2025
- Questions to Ask When Thinking Like a Product Leader - July 3, 2025
- Three Approaches to Creating AI Agents: Code Examples - June 27, 2025
I found it very helpful. However the differences are not too understandable for me