Category Archives: Data Science
Hypothesis Testing in Business: Examples
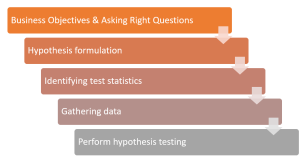
Are you a product manager or data scientist looking for ways to identify and use most appropriate hypothesis testing for understanding business problems and creating solutions for data-driven decision making? Hypothesis testing is a powerful statistical technique that can help you understand problems during exploratory data analysis (EDA) and identify most appropriate hypotheses / analytical solution. In this blog, we will discuss hypothesis testing with examples from business. We’ll also give you tips on how to use it effectively in your own problem-solving journey. With this knowledge, you’ll be able to confidently create hypotheses, run experiments, and analyze the results to derive meaningful conclusions. So let’s get started! Before going …
Sklearn Algorithms Cheat Sheet with Examples

The Sklearn library, short for Scikit-learn, is one of the most popular and widely-used libraries for machine learning in Python. It offers a comprehensive set of tools for data analysis, preprocessing, model selection, and evaluation. As a beginner data scientist, it can be overwhelming to navigate the various algorithms and functions within Sklearn. This is where the Sklearn Algorithms Cheat Sheet comes in handy. This cheat sheet provides a quick reference guide for beginners to easily understand and select the appropriate algorithm for their specific task. In this cheat sheet, I have compiled a list of common supervised and unsupervised learning algorithms, along with their Sklearn classes and example use …
Supervised & Unsupervised Learning Difference
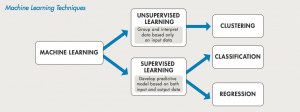
Supervised and unsupervised learning are two different common types of machine learning tasks that are used to solve many different types of business problems. Supervised learning uses training data with labels to create supervised models, which can be used to predict outcomes for future datasets. Unsupervised learning is a type of machine learning task where the training data is not labeled or categorized in any way. For beginner data scientists, it is very important to get a good understanding of the difference between supervised and unsupervised learning. In this post, we will discuss how supervised and unsupervised algorithms work and what is difference between them. You may want to check …
Sklearn Neural Network Example – MLPRegressor
Are you interested in using neural networks to solve complex regression problems, but not sure where to start? Sklearn’s MLPRegressor can help you get started with building neural network models for regression tasks. While the packages from Keras, Tensorflow or PyTorch are powerful and widely used in deep learning, Sklearn’s MLPRegressor is still an excellent choice for building neural network models for regression tasks when you are starting on. Recall that Python Sklearn library is one of the most popular machine learning libraries, and it provides a wide range of algorithms for classification, regression, clustering, dimensionality reduction, and more. In this blog post, we will be focusing on training a …
Neural Networks Interview Questions – Quiz #45

Are you preparing for a job interview in the field of deep learning or neural networks? If so, you’re likely aware of how complex and technical these topics can be. In order to help you prepare, we’ve put together a list of common neural network interview questions and answers in form of multiple-choice quiz. The quiz in this blog post covers basic concepts related to neural network layers, perceptron, multilayer perceptron, activation functions, feedforward networks, backpropagation, and more. We’ve included 15 multiple-choice questions, as well as 5 additional questions specifically focused on the backpropagation algorithm. I will be posting many more quizzes on the neural networks in time to come, …
Google’s Free Machine Learning Courses: Learn from the Best

Machine learning has become a fundamental part of almost every industry today. With the increasing demand for data scientists and machine learning engineers, it has become imperative for professionals to keep themselves updated with the latest tools and techniques. Fortunately, Google offers a range of free machine learning courses that cater to professionals of all expertise levels. In this blog, we will explore the top Google machine learning courses that will help learners enhance their skills and stay ahead of the game. List of Free Machine Learning Courses by Google The following is a list of free machine learning courses from Google which you can take online. These courses can …
KMeans Silhouette Score Python Example
If you’re building machine learning models for solving different prediction problems, you’ve probably heard of clustering. Clustering is a popular unsupervised learning technique used to group data points with similar features into distinct clusters. One of the most widely used clustering algorithms is KMeans, which is popular due to its simplicity and efficiency. However, one major challenge in clustering is determining the optimal number of clusters that should be used to group the data points. This is where the Silhouette Score comes into play, as it helps us measure the quality of clustering and determine the optimal number of clusters. Silhouette score helps us get further clarity for the following …
Why & When to use Eigenvalues & Eigenvectors?

Eigenvalues and eigenvectors are important concepts in linear algebra that have numerous applications in data science. They provide a way to analyze the structure of linear transformations and matrices, and are used extensively in many areas of machine learning, including feature extraction, dimensionality reduction, and clustering. In simple terms, eigenvalues and eigenvectors are the building blocks of linear transformations. Eigenvalues represent the scaling factor by which a vector is transformed when a linear transformation is applied, while eigenvectors represent the directions in which the transformation occurs. In this post, you will learn about why and when you need to use Eigenvalues and Eigenvectors? As a data scientist/machine learning Engineer, one must …
Z-score or Z-statistics: Concepts, Formula & Examples
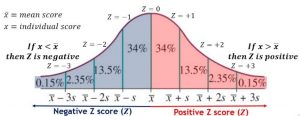
Z-score, also known as the standard score or Z-statistics, is a powerful statistical concept that plays a vital role in the world of data science. It provides a standardized method for comparing data points from different distributions, allowing data scientists to better understand and interpret the relative positioning of individual data points within a dataset. Z-scores represent a statistical technique of measuring the deviation of data from the mean. It is also used with Z-test which is a hypothesis testing statistical technique (one sample Z-test or two samples Z-test). As a data scientist, it is of utmost importance to be well-versed with the z-score formula and its various applications. Having …
Descriptive Statistics – Key Concepts & Examples
Descriptive statistics is a branch of statistics that deals with the analysis of data. It is concerned with summarizing and describing the characteristics of a dataset. It is one of the most fundamental tool for data scientists to understand the data as they get started working on the dataset. In this blog post, I will cover the key concepts of descriptive statistics, including measures of central tendency, measures of spread and statistical moments. What’s Descriptive Statistics & Why do we need it? Descriptive statistics is used to summarize and describe the characteristics of a dataset in terms of understanding its mean & related measures, spread or dispersion of the data …
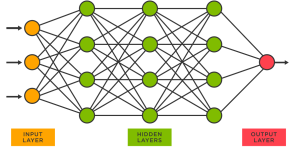
Backpropagation Algorithm in Neural Network: Examples
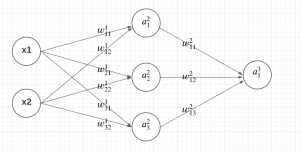
Artificial Neural Networks (ANN) are a powerful machine learning / deep learning technique inspired by the workings of the human brain. Neural networks comprise multiple interconnected nodes or neurons that process and transmit information. They are widely used in various fields such as finance, healthcare, and image processing. One of the most critical components of an ANN is the backpropagation algorithm. Backpropagation algorithm is a supervised learning technique used to adjust the weights of a Neural Network to minimize the difference between the predicted output and the actual output. In this post, you will learn about the concepts of backpropagation algorithm used in training neural network models, along with Python …
SVM RBF Kernel Parameters: Python Examples
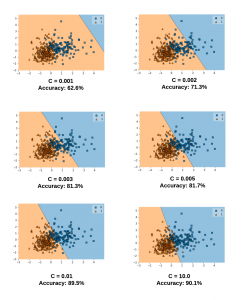
Support vector machines (SVM) are a popular and powerful machine learning technique for classification and regression tasks. SVM models are based on the concept of finding the optimal hyperplane that separates the data into different classes. One of the key features of SVMs is the ability to use different kernel functions to model non-linear relationships between the input variables and the output variable. One such kernel is the radial basis function (RBF) kernel, which is a popular choice for SVMs due to its flexibility and ability to capture complex relationships between the input and output variables. The RBF kernel has two important parameters: gamma and C (also called regularization parameter). …
A/B Testing & Data Science Projects: Examples
Today, when organization is aiming to become data-driven, it is imperative that their data science and product management teams understand the importance of using A/B testing technique for validating or supporting their decisions. A/B testing is a powerful technique that allows product management and data science teams to test changes to their products or services with a small group of users before implementing them on a larger scale. In data science projects, A/B testing can help measure the impact of machine learning models and the content driven based on the their predictions, and other data-driven changes. This blog explores the principles of A/B testing and its applications in data science. …
Data Science Careers: India’s Job Market & AI Growth
Aspiring data scientists and AI enthusiasts in India have a plethora of opportunities in store, thanks to the country’s booming AI, machine learning (ML), and big data analytics industry. According to a recent report by NASSCOM, India boasts the second-largest talent pool globally in these fields, with a remarkable AI skill penetration score of 3.09 [1]. The nation’s rapid growth in AI talent concentration and scientific publications underscores the immense potential for individuals looking to build a successful data science career in India. As the demand for skilled professionals surges, multiple factors contribute to the thriving industry. The higher-than-average compensation and growth prospects in the field make it an attractive …
Quiz #86: Large Language Models Concepts

In the ever-evolving field of data science, large language models (LLMs) have become a crucial component in natural language processing (NLP) and AI applications. As a data scientist, keeping up with the latest developments and understanding the core concepts of LLMs can give you a competitive edge, whether you’re working on cutting-edge projects or preparing for job interviews. In this quiz, we have carefully curated a set of questions that cover the essentials of large language models, including their purpose, architecture, types, applications, and more. By attempting this quiz, you’ll not only test your current knowledge but also solidify your understanding of LLM concepts. This will prove valuable when discussing …
Quiz #85: MSE vs R-Squared?

Regression models are an essential tool for data scientists and statisticians to understand the relationship between variables and make predictions about future outcomes. However, evaluating the performance of these models is a crucial step in ensuring their accuracy and reliability. Two commonly used metrics for evaluating regression models are Mean Squared Error (MSE) and R-squared. Understanding when to use each metric and how they differ can greatly improve the quality of your analyses. Check out my related blog on this topic – Mean Squared Error vs R-Squared? Which one to use? To help you test your knowledge on MSE and R-squared (also known as coefficient of determination), we have created …

I found it very helpful. However the differences are not too understandable for me