Author Archives: Ajitesh Kumar
Sklearn SimpleImputer Example – Impute Missing Data
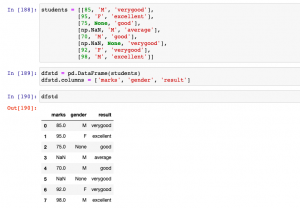
In this post, you will learn about how to use Python’s Sklearn SimpleImputer for imputing / replacing numerical & categorical missing data using different strategies. In one of the related article posted sometime back, the usage of fillna method of Pandas DataFrame is discussed. Handling missing values is key part of data preprocessing and hence, it is of utmost importance for data scientists / machine learning Engineers to learn different techniques in relation imputing / replacing numerical or categorical missing values with appropriate value based on appropriate strategies. SimpleImputer Python Code Example SimpleImputer is a class in the sklearn.impute module that can be used to replace missing values in a dataset, using a …
Pandas dropna: Drop Rows & Columns with Missing Values
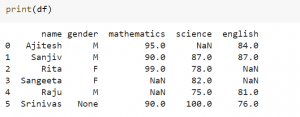
In this blog post, we will be discussing Pandas’ dropna method. This method is used for dropping rows and columns that have missing values. Pandas is a powerful data analysis library for Python, and the dropna function is one of its most useful features. As data scientists, it is important to be able to handle missing data, and Pandas’ dropna function makes this easy. Pandas dropna Method Pandas’ dropna function allows us to drop rows or columns with missing values in our dataframe. Find the documentation of Pandas dropna method on this page: pandas.DataFrame.dropna. The dropna method looks like the following: DataFrame.dropna(axis=0, how=’any’, thresh=None, subset=None, inplace=False) Given the above method and parameters, the following …
Spend Analytics Use Cases: AI & Data Science
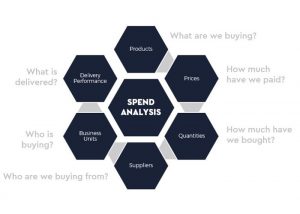
In this post, you will learn about the high-level concepts of spend analytics in relation to procurement and how data science / machine learning & AI can be used to extract actionable insights as part of spend analytics. This will be useful for procurement professionals such as category managers, sourcing managers, and procurement analytics stakeholders looking to understand the concepts of spend analytics and how they can drive decisions based on spend analytics. What is Spend Analytics? Simply speaking, spend analytics is about performing systematic computational analysis to extract actionable insights from spend and savings data across different categories of spends in order to achieve desired business outcomes such as cost savings, …
Perceptron Explained using Python Example
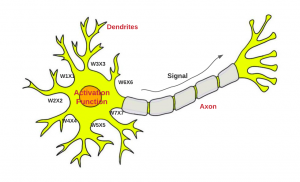
In this post, you will learn about the concepts of Perceptron with the help of Python example. It is very important for data scientists to understand the concepts related to Perceptron as a good understanding lays the foundation of learning advanced concepts of neural networks including deep neural networks (deep learning). What is Perceptron? Perceptron is a machine learning algorithm which mimics how a neuron in the brain works. It is also called as single layer neural network consisting of a single neuron. The output of this neural network is decided based on the outcome of just one activation function associated with the single neuron. In perceptron, the forward propagation of information happens. Deep …
Linear vs Non-linear Data: How to Know

In this post, you will learn the techniques in relation to knowing whether the given data set is linear or non-linear. Based on the type of machine learning problems (such as classification or regression) you are trying to solve, you could apply different techniques to determine whether the given data set is linear or non-linear. For a data scientist, it is very important to know whether the data is linear or not as it helps to choose appropriate algorithms to train a high-performance model. You will learn techniques such as the following for determining whether the data is linear or non-linear: Use scatter plot when dealing with classification problems Use …
Insurance Machine Learning Use Cases

As insurance companies face increasing competition and ever-changing customer demands, they are turning to machine learning for help. Machine learning / AI can be used in a variety of ways to improve insurance operations, from developing new products and services to improving customer experience. It would be helpful for product manager and data science architects to get a good understanding around some of the use cases which can be addressed / automated using machine learning / AI based solutions. In this blog post, we will explore some of the most common insurance machine learning / AI use cases. Stay tuned for future posts that will dive into each of these …
Invoice Processing Machine Learning Use Cases

Invoice processing is a critical part of any business. It’s the process of creating, managing, and paying invoices. Without invoice processing, businesses would have a difficult time keeping track of their finances. There are many different invoice processing use cases. For example, businesses can use invoice processing to keep track of customer payments, manage vendor contracts, and streamline their accounting processes. Invoice processing can also be used to detect fraud and prevent errors. Machine learning / AI can be used to improve invoice processing in a number of ways. As a product manager, it will be helpful to understand these use cases and how machine learning can be used to …
Tail Spend Management & Spend Analytics
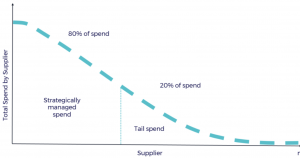
Do you know where your business is spending its money? And more importantly, do you know where your business SHOULD be spending its money? Many businesses don’t have a good handle on their tail spend – the money that’s spent on things that are not essential to the core operations of the company. Tail spend can be difficult to track and manage, but with the help of spend analytics tools and machine learning, it’s becoming easier than ever before. In this blog post, we’ll discuss what tail spend is, how to track it, and how to use analytics and machine learning to make better decisions about where to allocate your …
Two sample Z-test for Proportions: Formula & Examples
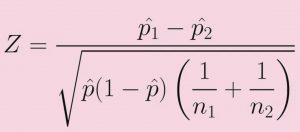
In statistics, a two-sample z-test for proportions is a method used to determine whether two samples are drawn from the same population. This test is used when the population proportion is unknown and there is not enough information to use the chi-squared distribution. The test uses the standard normal distribution to calculate the test statistic. As data scientists, it is important to know how to conduct this test in order to determine whether two proportions are equal. In this blog post, we will discuss the formula and examples of the two-proportion Z-test. What is two proportion Z-test? A two-proportion Z-test is a statistical hypothesis test used to determine whether two …
Decision Making Models: Concepts, Examples, Importance
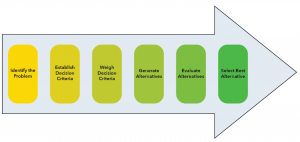
Making decisions is a critical part of business operations. However, making the right decision is not always easy. There are a number of different decision models that organizations can use to make better decisions. In this blog post, we will discuss some of the most popular decision models, what is their importance, and explain how they can be used to create desired business outcomes with the help of examples. In addition, we will also learn how could data and insights be used to drive decisions while implementing different kind of decision models. A decision scientist should be aware of these concepts fairly well. Decision models & different types Decision making …
Healthcare & Machine Learning Use Cases / Projects

AI & Machine learning is being used more and more in the healthcare industry. This is because it has the potential to improve patient outcomes, make healthcare more cost-effective, and help with other important tasks. In this blog post, we will discuss some of the healthcare & AI / machine learning use cases that are currently being implemented. We will also talk about the benefits of using machine learning in healthcare settings. Stay tuned for an exciting look at the future of healthcare! What are top healthcare challenges & related AI / machine learning use cases? Before getting into understand how machine learning / AI can be of help in …
Marketing Analytics Machine Learning Use Cases

If you’re like most business owners, you’re always looking for ways to improve your marketing efforts. You may have heard about marketing analytics and machine learning, but you’re not sure how they can help you. Marketing analytics is an essential tool for modern marketers. In this blog post, we will discuss some of the ways marketing analytics and AI / machine learning / Data science can be used to improve your marketing efforts. We’ll also give some real-world examples of how these technologies are being used by businesses today. So, if you’re ready to learn more about marketing analytics and machine learning, keep reading! What is marketing and what are …
Machine Learning Use Cases for Climate Change

Climate change is a serious issue facing the world. The climate changes which are already affecting our planet can be seen in rising sea levels, melting ice caps and glaciers, more severe storms and hurricanes, more droughts, and wildfires increased precipitation in some areas of the world while other regions experience less rainfall. It’s important that we do what we can to reduce climate change risks by reducing greenhouse gas emissions into the atmosphere as well as adapting to climate impacts. Artificial intelligence (AI), machine learning (ML)/ deep learning (DL), data science, advanced analytics have been widely used for decades across different industries such as finance, healthcare, etc., but their …
What is Human Data Science?

There’s a lot of buzz around the term “human data science.” What is it, and why should you care? Human data science is a relatively new field that combines the study of humans with the techniques of data science. By understanding human behavior and using big data techniques, unique and actionable insights can be obtained that weren’t possible before. In this blog post, we’ll discuss what human data science is and give some examples of how it’s being used today. What is human data science? Human data science is the study of humans using data science techniques. It’s a relatively new field that is growing rapidly as we learn more …
Pricing Optimization & Machine Learning Techniques
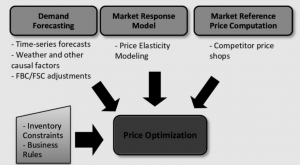
Pricing is a critical component of price optimization. In this blog post, we will dive into pricing optimization techniques and machine learning use cases. Price optimization techniques are used to optimize pricing for products or services based on customer response. AI / Machine learning can be leveraged in pricing optimization by using predictive analytics to predict consumer demand patterns and identify optimal prices for a products or services at a given time in the future. What is pricing optimization? Price optimization is a process where businesses use price discrimination to maximize revenue from customers. It is the process of pricing goods and services to maximize profits by taking into account …
Cash Forecasting Models & Treasury Management

As a business owner, you are constantly working to ensure that your company has the cash it needs to operate. Cash forecasting is one of the most important aspects of treasury management, and it’s something that you should be paying attention to. Cash forecasting is a great example of where machine learning can have a real impact. By using historical data, we can build models that predict future cash flow for a company. This enables treasury managers to make better decisions about how to allocate resources and manage risks. As data scientists or machine learning engineers, it is important to be able to understand and explain the business value of …

I found it very helpful. However the differences are not too understandable for me