Author Archives: Ajitesh Kumar
Generative AI: Scaling Techniques for LLM Models
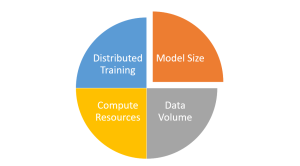
In the rapidly evolving world of artificial intelligence, large language models (LLMs) have emerged as a game-changing force, revolutionizing the way we interact with technology and transforming countless industries. These powerful models can perform a vast array of tasks, from text generation and translation to question-answering and summarization. However, unlocking the full potential of these LLMs requires a deep understanding of how to effectively scale these LLMs, ensuring optimal performance and capabilities. In this blog post, we will delve into the crucial concept of scaling techniques for LLM models and explore why mastering this aspect is essential for anyone working in the AI domain. As the complexity and size of …
Meta Unveils SAM and Massive SA-1B Dataset to Advance Computer Vision Research

Meta Researchers have, yesterday, unveiled a groundbreaking new model, namely Segment Anything Model (SAM), alongside an immense dataset, the Segment Anything Dataset (SA-1B), which together promise to revolutionize the field of computer vision. SAM’s unique architecture and design make it efficient and effective, while the SA-1B dataset provides a powerful resource to fuel future research and applications. The Segment Anything Model is an innovative approach to promptable segmentation that combines an image encoder, a flexible prompt encoder, and a fast mask decoder. Its design allows for real-time, interactive prompting in a web browser on a CPU, opening up new possibilities for computer vision applications. One of the key challenges SAM …
Quiz #85: MSE vs R-Squared?

Regression models are an essential tool for data scientists and statisticians to understand the relationship between variables and make predictions about future outcomes. However, evaluating the performance of these models is a crucial step in ensuring their accuracy and reliability. Two commonly used metrics for evaluating regression models are Mean Squared Error (MSE) and R-squared. Understanding when to use each metric and how they differ can greatly improve the quality of your analyses. Check out my related blog on this topic – Mean Squared Error vs R-Squared? Which one to use? To help you test your knowledge on MSE and R-squared (also known as coefficient of determination), we have created …
Machine Learning: Identify New Features for Disease Diagnosis
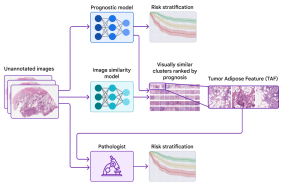
When diagnosing diseases that require X-rays and image-based scans, such as cancer, one of the most important steps is analyzing the images to determine the disease stage and to characterize the affected area. This information is central to understanding clinical prognosis and for determining the most appropriate treatment. Developing machine learning (ML) / deep learning (DL) based solutions to assist with the image analysis represents a compelling research area with many potential applications. Traditional modeling techniques have shown that deep learning models can accurately identify and classify diseases in X-rays and image-based scans and can even predict patient prognosis using known features, such as the size or shape of the …
Data Storytelling Explained with Examples
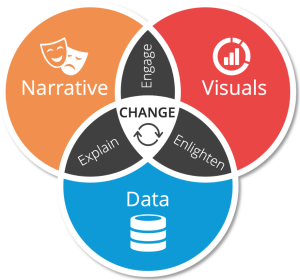
Have you ever told a story to someone, but they just didn’t seem to understand it? They might have been confused about the plot or why the characters acted in certain ways. If this has happened to you before, then you are not alone. Many people struggle with storytelling or rather data storytelling because they do not know how to communicate their data effectively to tell an engaging story. Data storytelling is a powerful tool that can be used to educate, inform or persuade an audience by using different kinds of narration. By using charts, graphs, images and other visuals, data can be made more interesting and engaging. Data storytelling …
Quiz: Linear Regression & F-Statistics

Linear Regression is one of the most widely used statistical methods for predictive modeling in various fields such as finance, marketing, and engineering. It involves fitting a linear equation to a set of data points, which can be used to make predictions about new data. One important aspect of linear regression is the use of F-Statistics, which is a statistical test used to determine the significance of the regression model. If you’re looking to test your knowledge of Linear Regression and F-Statistics, you’ve come to the right place! It will also be helpful if you are preparing for data science interviews. In this capsule quiz, we’ve compiled 10 questions that …
Meta AI Announces Advancements in Embodied AI: Artificial Visual Cortex & Adaptive Skill Coordination

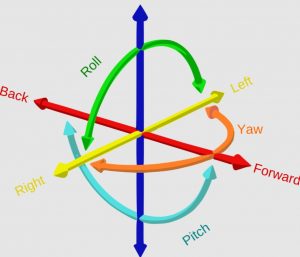
Meta AI has announced two major advancements in general-purpose embodied AI agents, focusing on challenging sensorimotor skills. These advancements include an artificial visual cortex called VC-1 and a new approach called Adaptive Skill Coordination (ASC). Both developments offer valuable benefits to data scientists and researchers in the field of AI. Embodied AI is field of AI focused on agents that can perceive, understand, and interact with their environment through sensorimotor experiences. It aims to create AI systems that can perform tasks in the physical world, bridging the gap between abstract thought and reasoning, and physical actions. VC-1 is a single perception model that supports a diverse range of sensorimotor skills, …
Python – Draw Confusion Matrix using Matplotlib
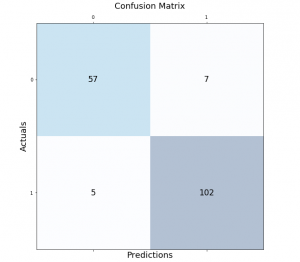
Classification models are a fundamental part of machine learning and are used extensively in various industries. Evaluating the performance of these models is critical in determining their effectiveness and identifying areas for improvement. One of the most common tools used for evaluating classification models is the confusion matrix. It provides a visual representation of the model’s performance by displaying the number of true positives, false positives, true negatives, and false negatives. In this post, we will explore how to create and visualize confusion matrices in Python using Matplotlib. We will walk through the process step-by-step and provide examples that demonstrate the use of Matplotlib in creating clear and concise confusion …
Degree of Freedom in Statistics: Meaning & Examples
The degree of freedom (DOF) is a term that statisticians use to describe the degree of independence in statistical data. A degree of freedom can be thought of as the number of variables that are free to vary, given one or more constraints. When you have one degree, there is one variable that can be freely changed without affecting the value for any other variable. As a data scientist, it is important to understand the concept of degree of freedom, as it can help you do accurate statistical analysis and validate the results. In this blog, we will explore the meaning of degree of freedom in statistics, its importance in …
Different types of Time-series Forecasting Models

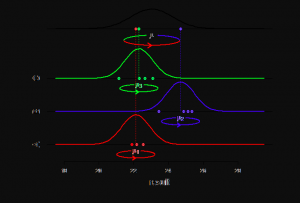
Forecasting is the process of predicting future events based on past and present data. Time-series forecasting is a type of forecasting that predicts future events based on time-stamped data points. Time-series forecasting models are an essential tool for any organization or individual who wants to make informed decisions based on future events or trends. From stock market predictions to weather forecasting, time-series models help us to understand and forecast changes over time. However, with so many different types of models available, it can be challenging to determine which one is best suited for a particular scenario. There are many different types of time-series forecasting models, each with its own strengths …
Transposed Convolution vs Convolution Layer: Examples
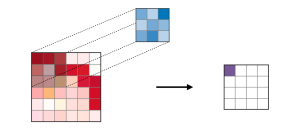
In the field of computer vision and deep learning, convolutional neural networks (CNNs) are widely used for image recognition tasks. A fundamental building block of CNNs is the convolutional layer, which extracts features from the input image by convolving it with a set of learnable filters. However, another type of layer called transposed convolution, also known as deconvolution, has gained popularity in recent years. In this blog post, we will compare and contrast these two types of layers, provide examples of their usage, and discuss their strengths and weaknesses. What are Convolutional Layer? What’s their purpose? A convolutional layer is a fundamental building block of a convolutional neural network (CNN). …
Support Vector Machine (SVM) Python Example
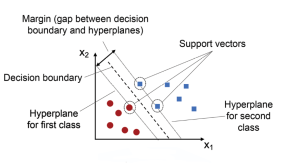
Support Vector Machines (SVMs) are a powerful and versatile machine learning algorithm that has gained widespread popularity among data scientists in recent years. SVMs are widely used for classification, regression, and outlier detection (one-class SVM), and have proven to be highly effective in solving complex problems in various fields, including computer vision (image classification, object detection, etc.), natural language processing (sentiment analysis, text classification, etc.), and bioinformatics (gene expression analysis, protein classification, disease diagnosis, etc.). In this post, you will learn about the concepts of Support Vector Machine (SVM) with the help of Python code example for building a machine learning classification model. We will work with Python Sklearn package for building the …
Fixed vs Random vs Mixed Effects Models – Examples
Have you ever wondered what fixed effect, random effect and mixed effects models are? Or, more importantly, how they differ from one another? In this post, you will learn about the concepts of fixed and random effects models along with when to use fixed effects models and when to go for fixed + random effects (mixed) models. The concepts will be explained with examples. As data scientists, you must get a good understanding of these concepts as it would help you build better linear models such as general linear mixed models or generalized linear mixed models (GLMM). What are fixed, random & mixed effects models? First, we will take a real-world example and try and understand …
CNN Basic Architecture for Classification & Segmentation

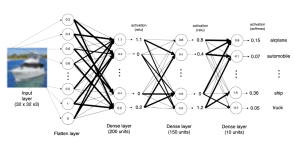
As data scientists, we are constantly exploring new techniques and algorithms to improve the accuracy and efficiency of our models. When it comes to image-related problems, convolutional neural networks (CNNs) are an essential tool in our arsenal. CNNs have proven to be highly effective for tasks such as image classification and segmentation, and have even been used in cutting-edge applications such as self-driving cars and medical imaging. Convolutional neural networks (CNNs) are deep neural networks that have the capability to classify and segment images. CNNs can be trained using supervised or unsupervised machine learning methods, depending on what you want them to do. CNN architectures for classification and segmentation include …
Keras: Multilayer Perceptron (MLP) Example
Artificial Neural Networks (ANN) have emerged as a powerful tool in machine learning, and Multilayer Perceptron (MLP) is a popular type of ANN that is widely used in various domains such as image recognition, natural language processing, and predictive analytics. Keras is a high-level API that makes it easy to build and train neural networks, including MLPs. In this blog, we will dive into the world of MLPs and explore how to build and train an MLP model using Keras. We will build a simple MLP model using Keras and train it on a dataset. We will explain different aspects of training MLP model using Keras. By the end of …
Neural Network & Multi-layer Perceptron Examples
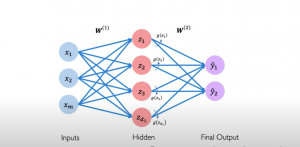
Neural networks are an important part of machine learning, so it is essential to understand how they work. A neural network is a computer system that has been modeled based on a biological neural network comprising neurons connected with each other. It can be built to solve machine learning tasks, like classification and regression problems. The perceptron algorithm is a representation of how neural networks work. The artificial neurons were first proposed by Frank Rosenblatt in 1957 as models for the human brain’s perception mechanism. This post will explain the basics of neural networks with a perceptron example. You will understand how a neural network is built using perceptrons. This …

I found it very helpful. However the differences are not too understandable for me