Text clustering has swiftly emerged as a cornerstone in data-driven decision-making across industries. But what exactly is text clustering, and how can it transform the way businesses operate? How does it convert unstructured text into actionable insights? What are the core steps involved in text clustering, and how are they interlinked? What algorithms are pivotal in implementing text clustering effectively? In this blog, we will unravel these questions, diving deep into the systematic steps of text clustering, its underlying algorithms, and real-world examples that bring this technique to life. Whether you’re a product manager seeking to leverage data analytics or a data scientist curious to learn key steps of text clustering with the help of examples, this blog will shed light on the vital role text clustering plays in extracting meaning from vast text data/corpus.
What’s Text Clustering & What are Key Steps?
Text clustering is a technique used to group documents into clusters so that documents within the same cluster are more similar to each other than to those in other clusters. It’s a common approach in natural language processing and machine learning to uncover hidden structures in a dataset, categorize documents, and enable information retrieval. Let’s break down the process into three crucial stages:
- Create document embeddings
- Reduce dimensionality
- Cluster the embeddings
Embed Documents
Raw text data is unstructured and cannot be directly fed into clustering algorithms. The challenge lies in converting the text into a numerical format that represents the semantic meaning of the text. The solution is embedding the documents. This stage involves converting the text documents into numerical representations/vectors that capture the essence of the text. Consider a collection of news articles. To group them by topics, the articles must first be transformed into numerical vectors. In other words, we need to embed news articles into a numerical representation.
The following are different methods used for creating document embedding.
- Bag-of-Words (BoW): A simple method that represents a document by the frequency of words. Each unique word in the document corresponds to an element in the vector, and its value is the count of occurrences of that word. It is a simple and computationally efficient method. It may be suitable for tasks where word frequency is more important than word order. The primary limitation of this method is that it ignores syntax, semantics, and word order, leading to a loss of contextual information.
- TF-IDF (Term Frequency-Inverse Document Frequency): This method weighs the words based on their importance in the document and across the corpus. It has become a foundational method in information retrieval and text mining. The term frequency (TF) represents how often a word appears in a document, relative to the total number of words in that document. The inverse document frequency (IDF) reflects how important a word is to the entire corpus. It helps to weigh down the common words that appear across many documents and aren’t informative. The overall TF-IDF score for a word in a document is the product of the TF and IDF scores for that word.
- Word Embeddings (e.g., Word2Vec, GloVe): These capture semantic meanings by representing words in continuous vector spaces.
- SBERT: The SBERT (Sentence-BERT) technique is a modification of the widely used BERT (Bidirectional Encoder Representations from Transformers) model, specifically designed to generate sentence or document embeddings. SBERT employs a Siamese network architecture, where two identical subnetworks are defined. SBERT is fine-tuned on specific tasks like sentence similarity, allowing it to generate embeddings that are more semantically meaningful.
Python Example for Creating Text Embeddings
The following code represents Python code example for creating text embeddings as a first step in doing text clustering to fine the topics. The example is worked with this file namely customer_complaints_1.csv. The text embeddings have been created using TF-IDF mentioned above.
import pandas as pd
from sklearn.feature_extraction.text import TfidfVectorizer

# Load the dataset (Google Colab)
df = pd.read_csv("/content/customer_complaints_1.csv")

# Initialize a TF-IDF vectorizer
tfidf_vectorizer = TfidfVectorizer(max_df=0.85, max_features=1000, stop_words='english')

# Fit and transform the complaints text to create embeddings
tfidf_matrix = tfidf_vectorizer.fit_transform(df['text'])

tfidf_matrix.shape
The TF-IDF embeddings have been created with a shape of (19, 751). This means we have 19 documents (complaints) and 751 features (terms) after filtering with our TF-IDF parameters.
Reduce Dimensionality
The document embeddings (numerical vectors) obtained from the above step might be very high-dimensional, leading to computational complexity and the curse of dimensionality. The solution is reducing dimensionality. This step aims to reduce the dimensionality of the document vectors while preserving essential information.
The following are some of the methods which can be used for dimensionality reduction:
- Principal Component Analysis (PCA): PCA identifies the axes (principal components) in the high-dimensional space that captures the most variance in the data. It projects the data onto these axes, reducing the dimensionality while retaining the most informative features. In text clustering, PCA can be applied to TF-IDF vectors or word embeddings to reduce dimensions. Helps in visualizing clusters and can make clustering algorithms like K-Means more efficient.
- t-SNE (t-Distributed Stochastic Neighbor Embedding): t-SNE minimizes the divergence between two distributions: one that measures pairwise similarities in the high-dimensional space and another in the low-dimensional space. It’s particularly good at preserving local structures. t-SNE can be applied to visualize clusters in text data, such as grouping similar documents or words.
- Uniform Manifold Approximation and Projection (UMAP): UMAP constructs a high-dimensional graph representing the data and then optimizes a low-dimensional graph to be as structurally similar as possible. It focuses on preserving both local and global structures. UMAP can be used with complex text embeddings, preserving semantic relationships in a lower-dimensional space. It facilitates better visualization and clustering of text data with nonlinear characteristics.
Python code for reducing dimensionality
In the code below, the dimensionality is reduced using PCA. Since we have 19 documents, let’s aim to reduce our features to a manageable number, say 2, for visualization purposes.
from sklearn.decomposition import PCA

# Initialize PCA and reduce dimensionality to 2 components
pca = PCA(n_components=2)
reduced_tfidf = pca.fit_transform(tfidf_matrix.toarray())

reduced_tfidf.shape
Cluster Embeddings
The final challenge is to group the documents in such a way that similar documents are in the same cluster. The solution is clustering the embeddings. This stage groups the reduced-dimensional vectors into clusters based on similarity.
The following are some of the methods which can be used for clustering the embeddings:
- K-Means Clustering: Partitions the vectors into K clusters, where each vector belongs to the cluster with the nearest mean.
- Hierarchical Clustering: Builds a tree of clusters, allowing a multilevel hierarchy. Methods such as Agglomerative Clustering can be used.
- DBSCAN (Density-Based Spatial Clustering of Applications with Noise): Groups together points that are closely packed together.
- HDBSCAN: HDBSCAN is a hierarchical clustering algorithm that can detect outliers and find dense clusters without specifying the number of clusters. It is straightforward to use by instantiating the model and fitting it to the reduced embeddings.
Determine optimal number of clusters for k-means
In this blog, we will cluster the embeddings using k-means. Before clustering the embeddings, an important consideration is determining the optimal number of clusters (i.e., the value of k). One common method to determine k is the Elbow method, where we plot the sum of squared distances for different values of k and look for the “elbow” point where the reduction in variance slows down. The following code helps you determine the optimal number of clusters using Elbow method. We will work with reduced dimension in previous step.
from sklearn.cluster import KMeans
import matplotlib.pyplot as plt

# Determine the optimal number of clusters using the Elbow method
wcss = []  # within-cluster sum of squares
cluster_range = range(1, 10)  # test up to 10 clusters

for k in cluster_range:
    kmeans = KMeans(n_clusters=k, random_state=42)
    kmeans.fit(reduced_tfidf)
    wcss.append(kmeans.inertia_)

# Plot the Elbow method
plt.figure(figsize=(10, 6))
plt.plot(cluster_range, wcss, marker='o', linestyle='--')
plt.xlabel('Number of Clusters')
plt.ylabel('Within-Cluster Sum of Squares')
plt.title('Elbow Method for Optimal Number of Clusters')
plt.grid(True)
plt.show()
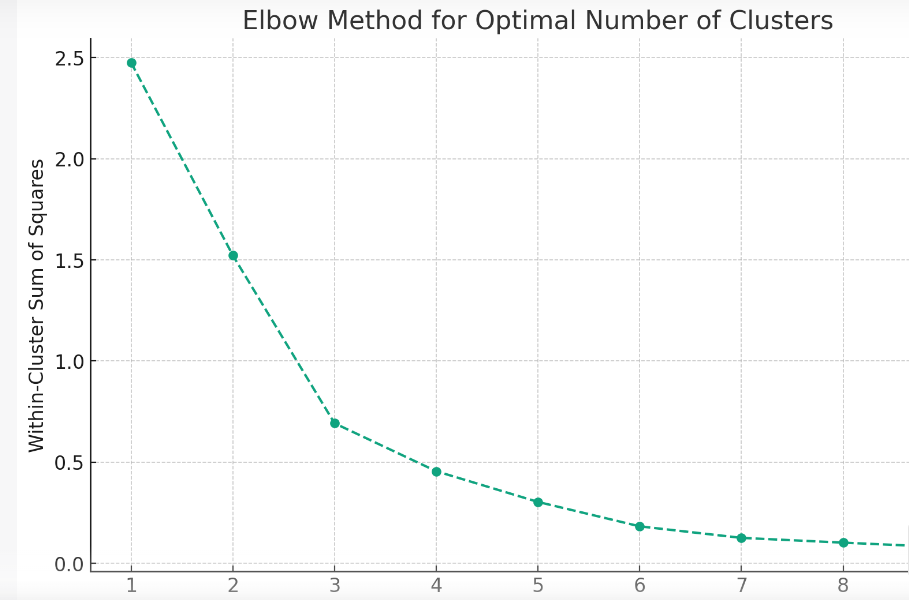
The “elbow” in the plot indicates the optimal number of clusters where the reduction in variance starts to slow down. In this case, it seems that around k = 3 or k = 4 is where the “elbow” starts to form. We will work with k=3 in this example.
Text Clustering using K-Means
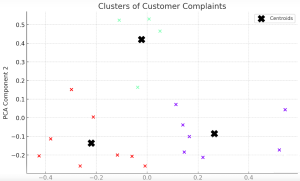
We will use k=3 for clustering the text using K-Means algorithm. Here is the Python code example.
# Perform KMeans clustering with 3 clusters
kmeans = KMeans(n_clusters=3, random_state=42)
clusters = kmeans.fit_predict(reduced_tfidf)

# Plot the clusters
plt.figure(figsize=(10, 6))
plt.scatter(reduced_tfidf[:, 0], reduced_tfidf[:, 1], c=clusters, cmap='rainbow')
plt.scatter(kmeans.cluster_centers_[:, 0], kmeans.cluster_centers_[:, 1], s=200, c='black', marker='X', label='Centroids')
plt.xlabel('PCA Component 1')
plt.ylabel('PCA Component 2')
plt.title('Clusters of Customer Complaints')
plt.legend()
plt.grid(True)
plt.show()
This is how the clusters will look like.

Text Clustering Real-world Examples
Below are some of the real-world examples of use cases where text clustering can prove to be beneficial:
Identifying Recurring Support Issues
Businesses often struggle with identifying common customer complaints, leading to repetitive and inefficient resolutions. Text clustering analyzes customer support interactions, groups similar queries or complaints, and highlights recurring issues, using techniques like TF-IDF with K-Means clustering. By identifying patterns, it helps in proactively addressing common problems, enhancing customer satisfaction, and providing quicker solutions.
Discovering New Content to Drive SEO Practices
Creating content that aligns with audience interests can be challenging, affecting SEO performance. Clustering website content to find topics that resonate with the audience is the solution, with tools like Word2Vec and hierarchical clustering uncovering hidden content opportunities. This alignment of content creation with audience interests not only boosts website traffic but also improves search engine rankings.
Detecting Topic Trends in Social Media
Staying ahead of rapidly changing social media trends is complex and can affect marketing effectiveness. The solution is to analyze social media posts and comments and cluster them by similarity to detect trends, using algorithms such as DBSCAN to detect dense clusters representing hot topics. This approach enables businesses to stay ahead of trends and adapt marketing strategies, enhancing engagement with customers by aligning with current interests.
Discovering Duplicate Content
Managing and identifying duplicate content is time-consuming and leads to inconsistency. Clustering documents to identify identical or very similar content within a database, using techniques such as cosine similarity with K-Means, can detect duplicates. This method helps in managing content efficiently, avoiding redundancy, and ensuring consistency across platforms.
Exploratory Data Analysis
Understanding the structure and themes within a large dataset is challenging and crucial for informed decision-making. Using text clustering as a preliminary step to understand the structure and themes within a dataset, and combining embedding methods like GloVe with dimensionality reduction techniques like PCA to visualize clusters, provides insights into data. This supports decision-making by uncovering hidden patterns and relationships, guiding further analysis.
Conclusion
Text clustering serves as a powerful tool in the analytical arsenal, enabling organizations to make sense of vast amounts of unstructured text data. Through the intricate key steps of embedding documents, reducing dimensionality, and clustering embeddings, valuable insights can be extracted, driving decision-making and strategic planning. Whether it’s the simplicity of Bag-of-Words, the relevance weighing of TF-IDF, SBERT, or the semantic richness of Word Embeddings, each embedding technique offers unique avenues for analysis. Moreover, dimensionality reduction techniques like PCA, UMAP, and t-SNE play a vital role in transforming high-dimensional text into manageable, visualizable forms, each with its distinctive benefits and limitations.
The applications of text clustering are as diverse as the methods employed, ranging from identifying recurring support issues to optimizing knowledge management systems. Its adaptability and efficacy underscore the importance of text clustering in today’s data-driven world. As technology continues to evolve, so too will the techniques and algorithms, opening new horizons for exploration and innovation. Ultimately, text clustering stands as a testament to the incredible potential of data science and machine learning, turning the chaos of unstructured text into structured understanding, and unlocking opportunities across industries and domains.

Check out my latest book titled as First Principles Thinking: Building winning products using first principles thinking.
- Mathematics Topics for Machine Learning Beginners - July 6, 2025
- Questions to Ask When Thinking Like a Product Leader - July 3, 2025
- Three Approaches to Creating AI Agents: Code Examples - June 27, 2025
I found it very helpful. However the differences are not too understandable for me