Tag Archives: Data Science
When to use LabelEncoder – Python Example

In this post, you will learn about when to use LabelEncoder. As a data scientist, you must have a clear understanding on when to use LabelEncoder and when to use other encoders such as One-hot Encoder. Using appropriate type of encoders is key part of data preprocessing in machine learning model building lifecycle. Here are some of the scenarios when you could use LabelEncoder without having impact on model. Use LabelEncoder when there are only two possible values of a categorical features. For example, features having value such as yes or no. Or, maybe, gender feature when there are only two possible values including male or female. Use LabelEncoder for …
Eigenvalues & Eigenvectors with Python Examples
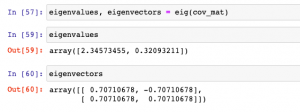
In this post, you will learn about how to calculate Eigenvalues and Eigenvectors using Python code examples. Before getting ahead and learning the code examples, you may want to check out this post on when & why to use Eigenvalues and Eigenvectors. As a machine learning Engineer / Data Scientist, you must get a good understanding of Eigenvalues / Eigenvectors concepts as it proves to be very useful in feature extraction techniques such as principal components analysis. Python Numpy package is used for illustration purpose. The following topics are covered in this post: Creating Eigenvectors / Eigenvalues using Numpy Linalg module Re-creating original transformation matrix from eigenvalues & eigenvectors Creating Eigenvectors / Eigenvalues using Numpy In …
Sklearn SelectFromModel for Feature Importance
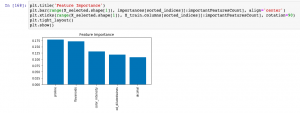
In this post, you will learn about how to use Sklearn SelectFromModel class for reducing the training / test data set to the new dataset which consists of features having feature importance value greater than a specified threshold value. This method is very important when one is using Sklearn pipeline for creating different stages and Sklearn RandomForest implementation (such as RandomForestClassifier) for feature selection. You may refer to this post to check out how RandomForestClassifier can be used for feature importance. The SelectFromModel usage is illustrated using Python code example. SelectFromModel Python Code Example Here are the steps and related python code for using SelectFromModel. Determine the feature importance using …
Sequential Forward Selection – Python Example
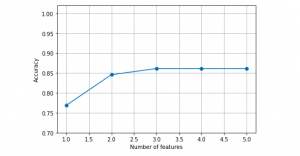
In this post, you will learn about one of feature selection techniques namely sequential forward selection with Python code example. Refer to my earlier post on sequential backward selection technique for feature selection. Sequential forward selection algorithm is a part of sequential feature selection algorithms. Some of the following topics will be covered in this post: Introduction to sequential feature selection algorithms Sequential forward selection algorithm Python example using sequential forward selection Introduction to Sequential Feature Selection Sequential feature selection algorithms including sequential forward selection algorithm belongs to the family of greedy search algorithms which are used to reduce an initial d-dimensional feature space to a k-dimensional feature subspace where k < d. …
Sequential Backward Feature Selection – Python Example
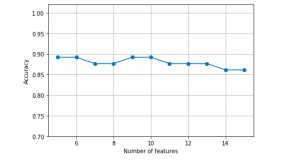
In this post, you will learn about a feature selection technique called as Sequential Backward Selection using Python code example. Feature selection is one of the key steps in training the most optimal model in order to achieve higher computational efficiency while training the model, and also reduce the the generalization error of the model by removing irrelevant features or noise. Some of the important feature selection techniques includes L-norm regularization and greedy search algorithms such as sequential forward or backward feature selection, especially for algorithms which don’t support regularization. It is of utmost importance for data scientists to learn these techniques in order to build optimal models. Sequential backward …
Pandas – Append Columns to Dataframe

In this post, you will learn different techniques to append or add one column or multiple columns to Pandas Dataframe (Python). There are different scenarios where this could come very handy. For example, when there are two or more data frames created using different data sources, and you want to select a specific set of columns from different data frames to create one single data frame, the methods given below can be used to append or add one or more columns to create one single data frame. It will be good to know these methods as it helps in data preprocessing stage of building machine learning models. In this post, …
Pandas – Fillna method for replacing missing values
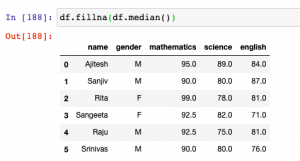
In this post, you will learn about how to use fillna method to replace or impute missing values of one or more feature column with central tendency measures in Pandas Dataframe (Python).The central tendency measures which are used to replace missing values are mean, median and mode. Here is a detailed post on how, what and when of replacing missing values with mean, median or mode. This will be helpful in the data preprocessing stage of building machine learning models. Other technique used for filling missing values is backfill or bfill and forward-fill or ffill. Before going further and learn about fillna method, here is the Pandas sample dataframe we will work with. It represents marks in …
Pandas Dataframe vs Numpy Array: What to Use?
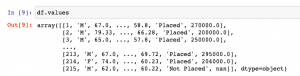
In this post, you will learn about which data structure to use between Pandas Dataframe and Numpy Array when working with Scikit Learn libraries. As a data scientist, it is very important to understand the difference between Numpy array and Pandas Dataframe and when to use which data structure. Here are some facts: Scikit learn was originally developed to work well with Numpy array Numpy Ndarray provides a lot of convenient and optimized methods for performing several mathematical operations on vectors. Numpy array can be instantiated using the following manner: np.array([4, 5, 6]) Pandas Dataframe is an in-memory 2-dimensional tabular representation of data. In simpler words, it can be seen …
Visualize Decision Tree with Python Sklearn Library
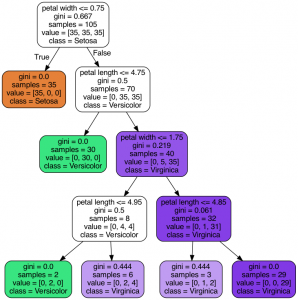
In this post, you will learn about different techniques you can use to visualize decision tree (a machine learning algorithm) using Python Sklearn (Scikit-Learn) library. The python code example would use Sklearn IRIS dataset (classification) for illustration purpose. The decision tree visualization would help you to understand the model in a better manner. The following are two different techniques which can be used for creating decision tree visualisation: Sklearn tree class (plot_tree method) Graphviz library Sklearn Tree Class for Visualization In this section, you will see the code sample for creating decision tree visualization using Sklearn Tree method plot_tree method. Sklearn IRIS dataset is used for training the model. Here is …
Decision Tree Classifier Python Code Example
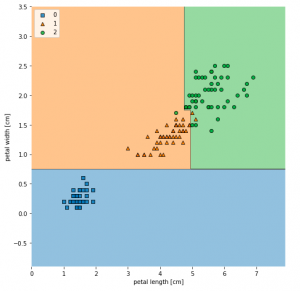
In this post, you will learn about how to train a decision tree classifier machine learning model using Python. The following points will be covered in this post: What is decision tree? Decision tree python code sample What is Decision Tree? Simply speaking, the decision tree algorithm breaks the data points into decision nodes resulting in a tree structure. The decision nodes represent the question based on which the data is split further into two or more child nodes. The tree is created until the data points at a specific child node is pure (all data belongs to one class). The criteria for creating the most optimal decision questions is …
Machine Learning – SVM Kernel Trick Example
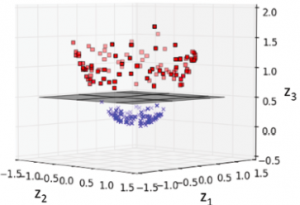
In this post, you will learn about what are kernel methods, kernel trick, and kernel functions when referred with a Support Vector Machine (SVM) algorithm. A good understanding of kernel functions in relation to the SVM machine learning (ML) algorithm will help you build/train the most optimal ML model by using the appropriate kernel functions. There are out-of-box kernel functions such as some of the following which can be applied for training models using the SVM algorithm: Polynomial kernel Gaussian kernel Radial basis function (RBF) kernel Sigmoid kernel The following topics will be covered: Background – Why Kernel concept? What is a kernel method? What is the kernel trick? What are …
Sklearn SVM Classifier using LibSVM – Code Example
In this post, you learn about Sklearn LibSVM implementation used for training an SVM classifier, with code example. Here is a great guide for learning SVM classification, especially, for beginners in the field of data science/machine learning. LIBSVM is a library for Support Vector Machines (SVM) which provides an implementation for the following: C-SVC (Support Vector Classification) nu-SVC epsilon-SVR (Support Vector Regression) nu-SVR Distribution estimation (one-class SVM) In this post, you will see code examples in relation to C-SVC, and nu-SVC LIBSVM implementations. I will follow up with code examples for SVR and distribution estimation in future posts. Here are the links to their SKLearn pages for C-SVC and nu-SVC …
SVM – Understanding C Value with Code Examples
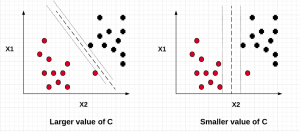
In this post, we will understand the importance of C value on the SVM soft margin classifier overall accuracy using code samples. In the previous post titled as SVM as Soft Margin Classifier and C Value, the concepts around SVM soft margin classifier and the importance of C value was explained. If you are not sure about the concepts, I would recommend reading earlier article. Lets take a look at the code used for building SVM soft margin classifier with C value. The code example uses the SKLearn IRIS dataset In the above code example, take a note of the value of C = 0.01. The model accuracy came out to …
SVM as Soft Margin Classifier and C Value
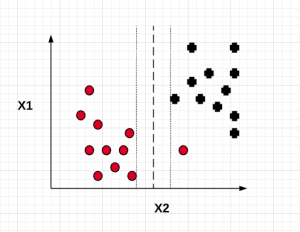
In this post, you will learn about SVM (Support Vector Machine) as Soft Margin Classifier and the importance of Value of C. In the previous post, we learned about SVM as maximum margin classifier. What & Why of SVM as Soft Margin Classifier? Before getting into understanding what is Soft Margin Classifier version of SVM algorithm, lets understand why we need it when we had a maximum margin classifier. Maximum margin classifier works well with linearly separable data such as the following: When maximum margin classifier is trained on the above data set with maximum distance (margin) between the closest points (support vectors), we can get a hyperplane which can separate the data in a clear …
SVM Algorithm as Maximum Margin Classifier
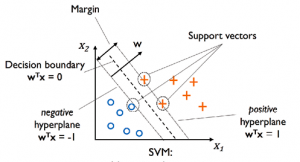
In this post, we will understand the concepts related to SVM (Support Vector Machine) algorithm which is one of the popular machine learning algorithm. SVM algorithm is used for solving classification problems in machine learning. Lets take a 2-dimensional problem space where a point can be classified as one or the other class based on the value of the two dimensions (independent variables, say) X1 and X2. The objective is to find the most optimal line (hyperplane in case of 3 or more dimensions) which could correctly classify the points with most accuracy. In the diagram below, you could find multiple such lines possible. In the above diagram, the objective is to find the …
Top 5 Data Analytics Methodologies

Here is a list of top 5 data analytics methodologies which can be used to solve different business problems and in a way create business value for any organization: Optimization: Simply speaking, an optimization problem consists of maximizing or minimizing a real function by systematically choosing input values (also termed as decision variables) from within an allowed set and computing the value of the function. An optimization problem consists of three things: A. Objective function B. Decision variables C. Constraint functions (this is optional) Linear / Non-linear programming with constrained / unconstrained optimization Linear programming with constrained optimization Objective function and one or more constraint functions are linear with decision variables as continuous variables Linear programming with unconstrained optimization Objective function …
I found it very helpful. However the differences are not too understandable for me