In this post, you will learn about how to use Sklearn SelectFromModel class for reducing the training / test data set to the new dataset which consists of features having feature importance value greater than a specified threshold value. This method is very important when one is using Sklearn pipeline for creating different stages and Sklearn RandomForest implementation (such as RandomForestClassifier) for feature selection. You may refer to this post to check out how RandomForestClassifier can be used for feature importance. The SelectFromModel usage is illustrated using Python code example.
SelectFromModel Python Code Example
Here are the steps and related python code for using SelectFromModel.
- Determine the feature importance using estimator such as RandomForestClassifier or RandomForestRegressor. Use the technique shown in this post. The data used in this post is Sklearn wine data set which can be loaded in the manner shown in this post.
- Create an estimator using SelectFromModel class that takes parameters such as estimator (RandomForestClassifier instance) and threshold
- Transform the training data to the dataset consisting of features value whose importance is greater than the threshold value.
- Create the visualization plot representing the feature
Here is the python code representing the above steps:
from sklearn.feature_selection import SelectFromModel
#
# Fit the estimator; forest is the instance of RandomForestClassifier
#
sfm = SelectFromModel(forest, threshold=0.1, prefit=True)
#
# Transform the training data set
#
X_training_selected = sfm.transform(X_train)
#
# Count of features whose importance value is greater than the threshold value
#
importantFeaturesCount = X_selected.shape[1]
#
# Here are the important features
#
X_train.columns[sorted_indices][:X_selected.shape[1]]
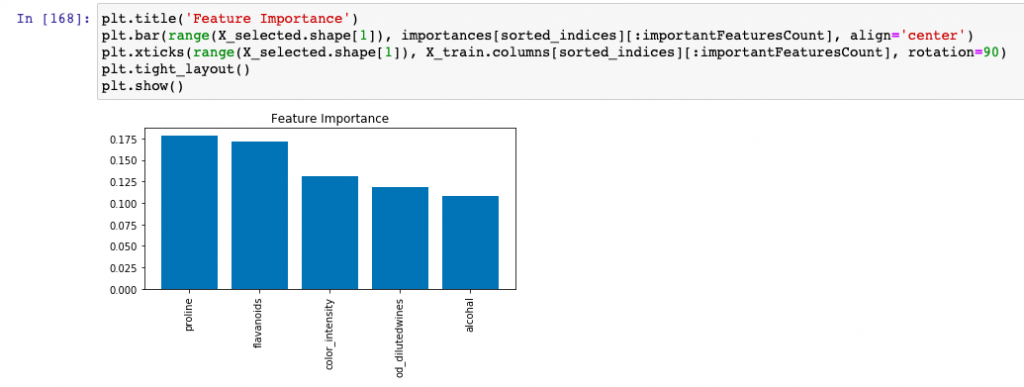
The above may give output such as the following as the important features whose importance is greater than threshold value:
Index(['proline', 'flavanoids', 'color_intensity', 'od_dilutedwines', 'alcohal'], dtype='object')
Here is the visualization plot for important features:

- Three Approaches to Creating AI Agents: Code Examples - June 27, 2025
- What is Embodied AI? Explained with Examples - May 11, 2025
- Retrieval Augmented Generation (RAG) & LLM: Examples - February 15, 2025
I found it very helpful. However the differences are not too understandable for me