
In this post, you will learn about different techniques you can use to visualize decision tree (a machine learning algorithm) using Python Sklearn (Scikit-Learn) library. The python code example would use Sklearn IRIS dataset (classification) for illustration purpose. The decision tree visualization would help you to understand the model in a better manner.
The following are two different techniques which can be used for creating decision tree visualisation:
- Sklearn tree class (plot_tree method)
- Graphviz library
Sklearn Tree Class for Visualization
In this section, you will see the code sample for creating decision tree visualization using Sklearn Tree method plot_tree method. Sklearn IRIS dataset is used for training the model.
import matplotlib.pyplot as plt
from sklearn import datasets
from sklearn.model_selection import train_test_split
from sklearn.tree import DecisionTreeClassifier
from sklearn import tree
#
# Load the IRIS dataset
#
iris = datasets.load_iris()
X = iris.data[:, 2:]
y = iris.target
#
# Create train and test split
#
X_train, X_test, y_train, y_test = train_test_split(X, y, test_size=0.3, random_state=1, stratify=y)
#
# Train the model using DecisionTree classifier
#
clf_tree = DecisionTreeClassifier(criterion='gini', max_depth=4, random_state=1)
clf_tree.fit(X_train, y_train)
#
# Plot the decision tree
#
fig, ax = plt.subplots(figsize=(10, 10))
tree.plot_tree(clf_tree, fontsize=10)
plt.show()
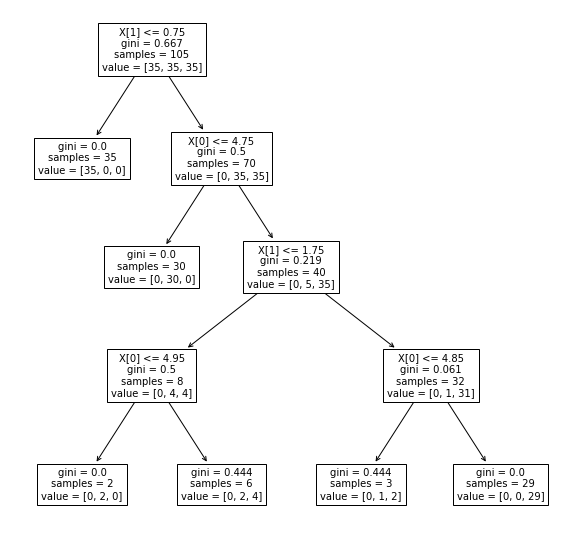
Here is how the decision tree would look like:
GraphViz for Decision Tree Visualization
In this section, you will learn about how to create a nicer visualization using GraphViz library. Here are the set of libraries such as GraphViz, PyDotPlus which you may need to install (in order) prior to creating the visualization. PyDotPlus converts dot data files into a decision tree image file.
pip install graphviz
pip install pyparsing
pip install pydotplus
Here is the code which can be used for creating visualization. It uses the instance of decision tree classifier, clf_tree, which is fit in the above code. Note some of the following in the code:
- export_graphviz function of Sklearn.tree is used to create the dot file
- Function, graph_from_dot_data is used to convert the dot file into image file.
from pydotplus import graph_from_dot_data
from sklearn.tree import export_graphviz

dot_data = export_graphviz(clf_tree, filled=True, rounded=True,
                                    class_names=['Setosa',
                                                'Versicolor',
                                                'Virginica'],
                                    feature_names=['petal length',
                                                'petal width'],
                                    out_file=None)
graph = graph_from_dot_data(dot_data)
graph.write_png('/Users/apple/Downloads/tree.png')
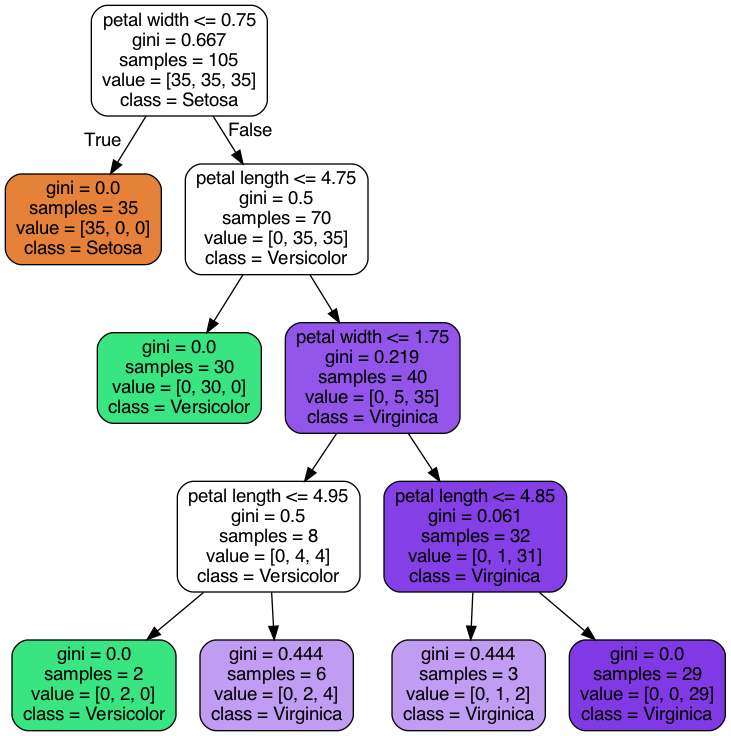
Here is how the tree visualization looks like. Note the difference between the tree visualization created using GraphViz (fig 2) and without using GraphViz (fig 1). Note some of the following in the tree drawn below:
- Root node splits the training dataset (105) into two child nodes with 35 and 70 data points.
- Left child node can be said as a pure or homogenous node as it has all the data points belonging to Setosa class. Thus, Gini impurity score is 0.
- Right child node is split further into two child nodes. The left child node results in the pure data set belonging to Versicolor class with Gini impurity as 0.
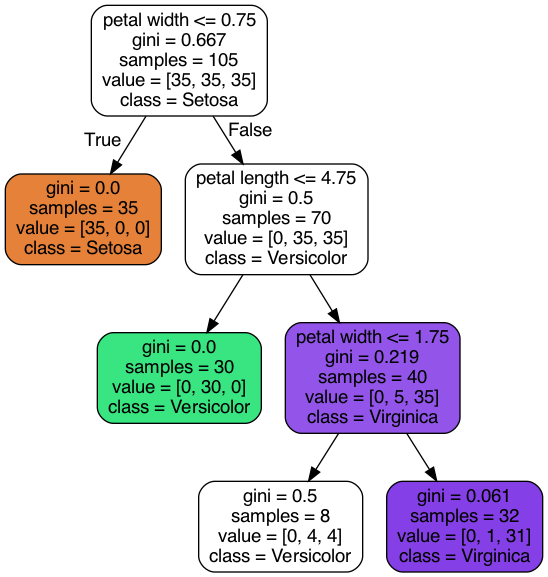
Change the max_depth of the tree as 3 and this is how the tree will look like.
In this post, you learned about how to create a visualization diagram of decision tree using two different techniques (Sklearn.tree plot_tree method) and GraphViz method.

Check out my latest book titled as First Principles Thinking: Building winning products using first principles thinking.
- Questions to Ask When Thinking Like a Product Leader - July 3, 2025
- Three Approaches to Creating AI Agents: Code Examples - June 27, 2025
- What is Embodied AI? Explained with Examples - May 11, 2025
I found it very helpful. However the differences are not too understandable for me