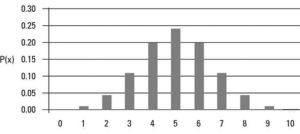
Positively Skewed Probability Distributions: Examples
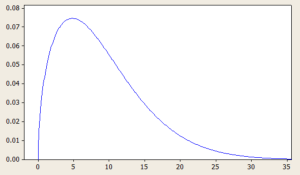
Probability distributions are an essential concept in statistics and data analysis. They describe the likelihood of different outcomes or events occurring and provide valuable insights into the characteristics of a given data set. Skewness is an important aspect of probability distributions that can have a significant impact on data analysis and decision-making. In this blog, we will focus on positively skewed probability distributions and explore some real-life examples where these distributions occur. We will discuss what a positively skewed distribution is, what are its different types with formula and definitions. By the end of this blog, you will have a better understanding of positively skewed distributions and be able to …
Data Analytics Training Program (Beginners)

Data analytics has become an integral part of businesses today, helping organizations make data-driven decisions that drive success. To become proficient in data analytics and solve complex business problems, it is essential to have a strong foundation in the key concepts and tools of data analytics. My online courses, which cover topics such as data-driven decision making / decision science, business statistics, python programming, machine learning, and business analytics, are designed to help learners of all levels become experts in these areas. Check out this page for detailed information: Become Data Analytics Pro! Each of these courses is designed to help learners acquire the skills and knowledge necessary to succeed …
Generative vs Discriminative Models: Examples
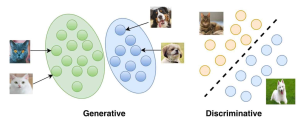
The field of machine learning is rapidly evolving, and with it, the concepts and techniques that are used to develop models that can learn from data. Among these concepts, generative and discriminative models are two widely used approaches in the field. Generative models learn the joint probability distribution of the input features and output labels, whereas discriminative models learn the conditional probability distribution of the output labels given the input features. While both models have their strengths and weaknesses, understanding the differences between them is crucial to developing effective machine learning systems. Real-world problems such as speech recognition, natural language processing, and computer vision, require complex solutions that are able …
Sequence to Sequence Models: Types, Examples
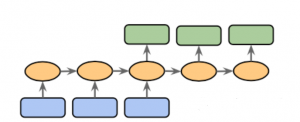
Sequence to sequence (Seq2Seq) modeling is a powerful machine learning technique that has revolutionized the way we do natural language processing (NLP). It allows us to process input sequences of varying lengths and produce output sequences of varying lengths, making it particularly useful for tasks such as language translation, speech recognition, and chatbot development. Sequence to sequence modeling also provides a great foundation for creating text summarizers, question answering systems, sentiment analysis systems, and more. With its wide range of applications, learning about sequence to sequence modeling concepts is essential for anyone who wants to work in the field of natural language processing. This blog post will discuss types of …
Analytics Maturity Model for Analytics COE
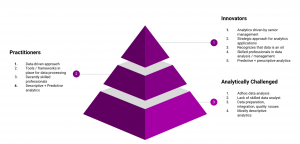
As businesses continue to embrace digital transformation, data analytics has become an essential component of business strategy. As a result, many organizations have established or are in the process of setting up an Analytics Center Of Excellence (Analytics COE) to drive analytics initiatives and improve their overall data-driven decision-making capabilities. TO achieve this objective, analytics COE requires a framework for assessing the maturity of their analytics practice. This is where analytics maturity model kicks in. The Analytics Maturity Model can be defined as a framework that enables organizations to assess their current analytics capabilities, identify areas for improvement, and establish a roadmap for analytics maturity. It provides a structured approach …
Analytics COE Team: Roles & Responsibilities

Data analytics Centers of Excellence (CoEs) are the key to unlocking a company’s full potential with data. As a business leader, you know how important it is to stay ahead of the curve and have access to timely, accurate analytics that can help inform decisions. But having access to this data isn’t enough—you need an experienced team in place who understand the nuances of data analytics, can develop models and uncover insights that drive business decisions. That’s where data analytics CoEs come in. In this blog post, we’ll explore the roles and responsibilities of staff members in data analytics CoEs, as well as their importance in enabling organizations by delivering …
Statistics Terminologies Cheat Sheet & Examples
Have you ever felt overwhelmed by all the statistics terminology out there? From sampling distribution to central limit theorem to null hypothesis to p-values to standard deviation, it can be hard to keep up with all the statistical concepts and how they fit into your research. That’s why we created a Statistics Terminologies Cheat Sheet & Examples – a comprehensive guide to help you better understand the essential terms and their use in data analysis. Our cheat sheet covers topics like descriptive statistics, probability, hypothesis testing, and more. And each definition is accompanied by an example to help illuminate the concept even further. Understanding statistics terminology is critical for data …
Difference between Probability & Statistics

Are you confused about the difference between probability and statistics? You are not alone! Many struggle to determine the key distinctions between these two closely related topics. In this blog, we will discuss the major differences between probability and statistics with the help of examples, as well as how they are used in the field of data science. By understanding the nuances between probability and statistics, you will be able to use these concepts appropriate when solving data science related problems. So here we go! Probability & Statistics Difference – By Example Take a bag of marbles. You got your hand in the bag blindly and grabbed a handful of …
Machine Learning Bias Explained with Examples
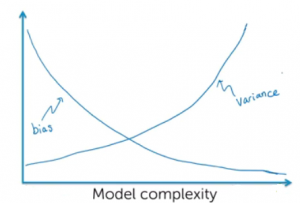
In the artificial intelligence (AI) / machine learning (ML) powered world where predictive models have started getting used more often in decision-making areas, the primary concerns of policy makers, auditors and end users have been to make sure that these systems using the models are not making biased/unfair decisions based on model predictions (intentional or unintentional discrimination). Imagine industries such as banking, insurance, and employment where models are used as solutions to decision-making problems such as shortlisting candidates for interviews, approving loans/credits, deciding insurance premiums etc. How harmful it could be to the end users as these decisions may impact their livelihood based on biased predictions made by the model, thereby, …
Geometric Distribution Concepts, Formula, Examples
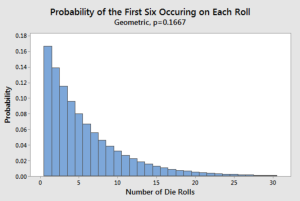
Geometric Distribution, a widely used concept in probability theory, is used to represent the probability of achieving success or failure in a series of independent trials, where the probability of success remains constant. It is one of the essential tools used in a wide range of fields, including economics, engineering, physics, and statistics. As data scientists / statisticians, it is of utmost important to understand its concepts and applications in a clear manner. In this blog, we will introduce you to the basics of Geometric distribution, starting with its definition and properties. We will also explore the geometric distribution formula and how it is used to calculate the probability of …
Data value chain: Framework, Concepts
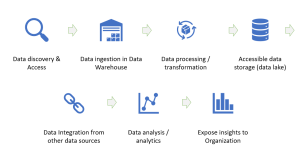
As organizations become increasingly data-driven, understanding the value of data is critical for success. The data value chain framework helps to identify and maximize the value of data by breaking it down into its components. In this post, we will explain what a data value chain is, why it’s important, and how to implement it. Data Value Chain Framework: Key Stages The data value chain (DVC) is a business model that helps organizations understand how to create, manage and utilize their data assets in order to realize maximum business value based on using them. It breaks down the various stages of an organization’s entire journey with its data into distinct …
Leading & Lagging KPIs – Concepts & Examples

Key performance indicators (KPIs) are important for any organization. They measure the success or failure of initiatives, projects and products with specific metrics and can be used to make informed decisions about future strategies. However, there is no one single definition of what a KPI is; instead, they come in many forms. KPIs are key metrics for product and project managers and are used to track the success of products and projects. This blog post will explore two types of KPIs – leading KPIs and lagging KPIs – as well as provide some examples. What are KPIs? KPIs are defined as a quantitative measure that indicates the performance of a …
Data Analysis Types: Concepts & Examples
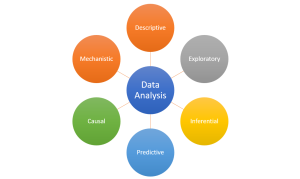
Data analysis plays an important role in understanding the world, discovering trends, and making decisions. Having a good understanding of the different types of data analysis available is essential for anyone looking to make sense of their data. In this blog post, we’ll discuss the six different forms of data analysis and provide examples of each type so you can get a better idea of how they work. The following is a representation of six forms of data analysis. Before getting ahead and understand different form of analysis, lets understand what is Data Analysis? The word “analysis” comes from the Ancient Greek ἀνάλυσις (analysis, “a breaking-up” or “an untying;” from …
Data Quality Characteristics & Examples
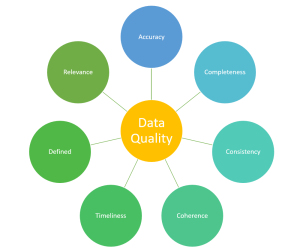
It is no secret that data is an essential component in the day-to-day operations of businesses—as well as the decision making processes. To ensure trust and reliability on the data, organizations must pay close attention to the quality of their data. In this blog post, we will discuss some of the key characteristics that make up quality data, diving into each characteristic and providing examples along the way. Good data governance strategies are also essential for maintaining high quality datasets across an organization’s entire IT infrastructure. These strategies include quality control processes for entering new data into the system; establishing internal documents with procedures for validating all incoming information; assigning …
Ensemble Methods in Machine Learning: Examples
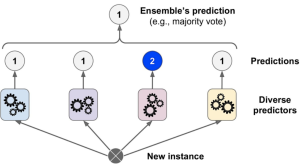
Machine learning models are often trained with a variety of different methods in order to create a more accurate prediction. Ensemble methods are one way to do this, and involve combining the predictions of several different models in order to get a more accurate result. When different models make predictions together, it can help create a more accurate result. Data scientists should care about this because it can help them create models that are more accurate. In this article, we will look at some of the common ensemble methods used in machine learning. Data scientists should care about this because it can help them create models that are more accurate. …
CART Decision Tree Python Example
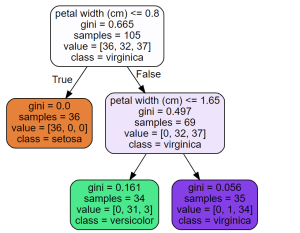
The Classification and Regression Tree (CART) is a supervised machine learning algorithm used for classification, regression. In this blog, we will discuss what CART decision tree is, how it works, and provide a detailed example of its implementation using Python. What is CART & How does it work? CART stands for Classification And Regression Tree. It is a type of decision tree which can be used for both classification and regression tasks based on non-parametric supervised learning method. The following represents the algorithm steps. First and foremost, the data is split into training and test set. Take a feature K and split the training data set into two subsets based on …

I found it very helpful. However the differences are not too understandable for me