When starting on the journey of learning machine learning and data science, we come across several different terminologies when going through different articles/posts, books & video lectures. Getting a good understanding of these terminologies and related concepts will help us understand these concepts in a nice manner. At a senior level, it gets tricky at times when the team of data scientists / ML engineers explain their projects and related outcomes. With this in context, this post lists down a set of commonly used machine learning terminologies that will help us get a good understanding of ML concepts and also engage with the DS / AI / ML team in a nice manner.
Here is a list of basic terminologies in machine learning & the related definitions:
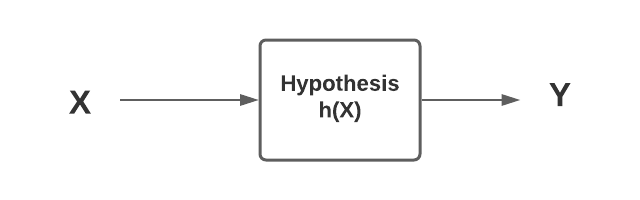
- Hypothesis: Hypothesis represents a function approximation for the target function. It is used to associate/estimate or predict the target value Y, based on the input dataset, X, model parameters, and hyper-parameters. It is represented using the letter, h. The hypothesis is also referred to as a model. The hypothesis can be represented as Y = h(X). Here is a diagram representing the hypothesis.
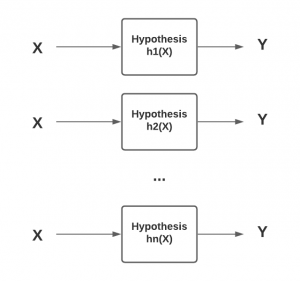
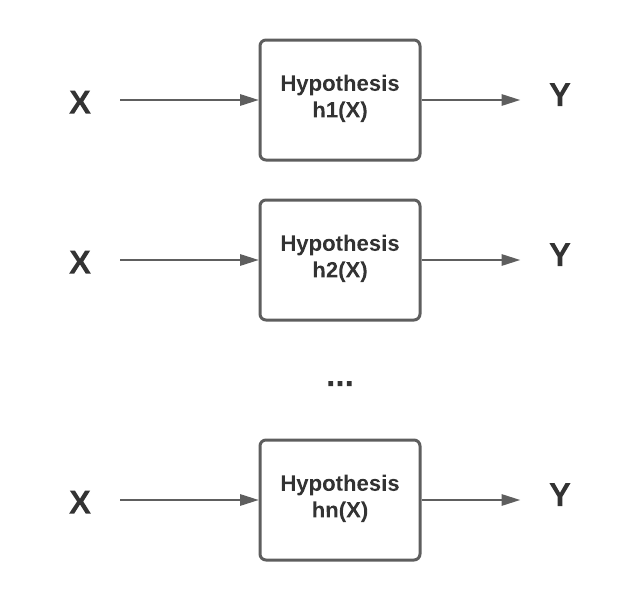
- Hypothesis space: Hypothesis space represents one or more hypothesis or function approximation or models which can be created using different training data set derived from the population. The different hypothesis or models is created using a combination of different training data set derived from the same population, features and hyper parameters. One or more hypothesis or functions can also be said to be part of what can be called as hypothesis class. The diagram below represents the same.
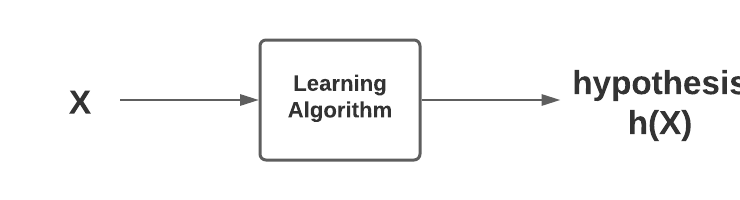
- Learning algorithm: Learning algorithm represents loss function and optimisation method. Based on the input dataset, Learning algorithm learns the most optimal value of model parameters and hyper-parameters. These model parameters and hyper-parameters constitute what is called as hypothesis. When we come across the term, machine learning algorithm, it could mean either of hypothesis and the learning algorithm (loss function & optimisation method). Learning algorithm is not same as the hypothesis or function approximation. The diagram given below represents the same.
- Loss function: Loss function or cost function is used to measure how accurate is the estimation or prediction made by the estimator or predictive model. Loss function is also termed as objective function. Loss function calculates the total loss related to prediction made on the training data set in each iteration. Loss function forms the key part of learning algorithm. The learning algorithm represents the usage of optimization techniques or methods on the loss function to learn the model parameters or elements of hypothesis. For regression model, the most popular loss function used is least squares method. For classification models, cross-entropy loss function is used.
- Optimization methods: Optimization methods or techniques are used to find the most optimal parameters of hypothesis or model according to the loss or objective function. One of the most popular optimisation method or technique is gradient descent method. You may want to check one of my related post such as Gradient Descent explained with examples. Thus, the gradient descent technique (an optimization method) can be used to find the most optional parameters of hypothesis or model (linear regression) according to the least squares function (objective function). A machine learning problem can as well be thought of as an optimization problem. The goal is to find three things – A. Optimization technique / method B. Hypothesis function C. Objective function
- Estimation and generalization: The machine learning model is used to estimate the value of response variable. This is called as estimator and the model is called as the estimator. Generalization is referred to as how good or accurate does the the model estimate the value of response variable given unseen data.
- Generalization error: The error that the model makes while making prediction on unseen dataset can be called as the generalization error.
- Training, validation and test set: The data used to come up with hypothesis or machine learning model can be split into three parts – A. Training data: The data used for training or fitting the model B. The data used for assessing the model performance (accuracy or error) C. The data used to assess the generalization performance of the model. This is the data set which is never used for model selection based on the performance. This dataset is used just once.
- Training and test error: The estimation error on the training data set is called as the training error. The estimation error on the test data set is called as the test error. Training error is also called as optimistically biased estimator of the generalization error because it assumes that the training set consists of representative data distribution of the population. However, there is a likelihood that training set might consist of the noise as well, or, may not consist of some representative dataset. Thus, the model trained on training data set may be called to be optimistically biased, and the training error may called to be optimistically biased error of the generalization error. On the other hand, test error is unbiased estimation of the generalization error. Rather, test error can said to be pessimistically biased error of the generalization error.
- Feature engineering: The process of identifying or deriving new features from the raw feature set is called as feature engineering.
- Feature selection: The process of selecting most importance features for fitting or training the model is called as feature selection. There are different techniques used for feature selection. For example, forward selection method, backward selection method, feature importance method etc.
- Dimensionality reduction: The process of reducing features set to best features which would result in model having good generalization accuracy is called as dimensionality reduction. Principal component analysis (PCA) is one of the most population dimensionality reduction technique. You may want to go through this article – Feature extraction using PCA – Python example
- Hyperparameters tuning: The process of selecting the most optimal model hyper parameters is called as the hyper parameters tuning. This is also called as model tuning. Algorithm having multiple hyperparameters have an access to larger hypothesis space and could result in model having overfitting. One would want to carefully choose the most optimal value of hyper-parameters.
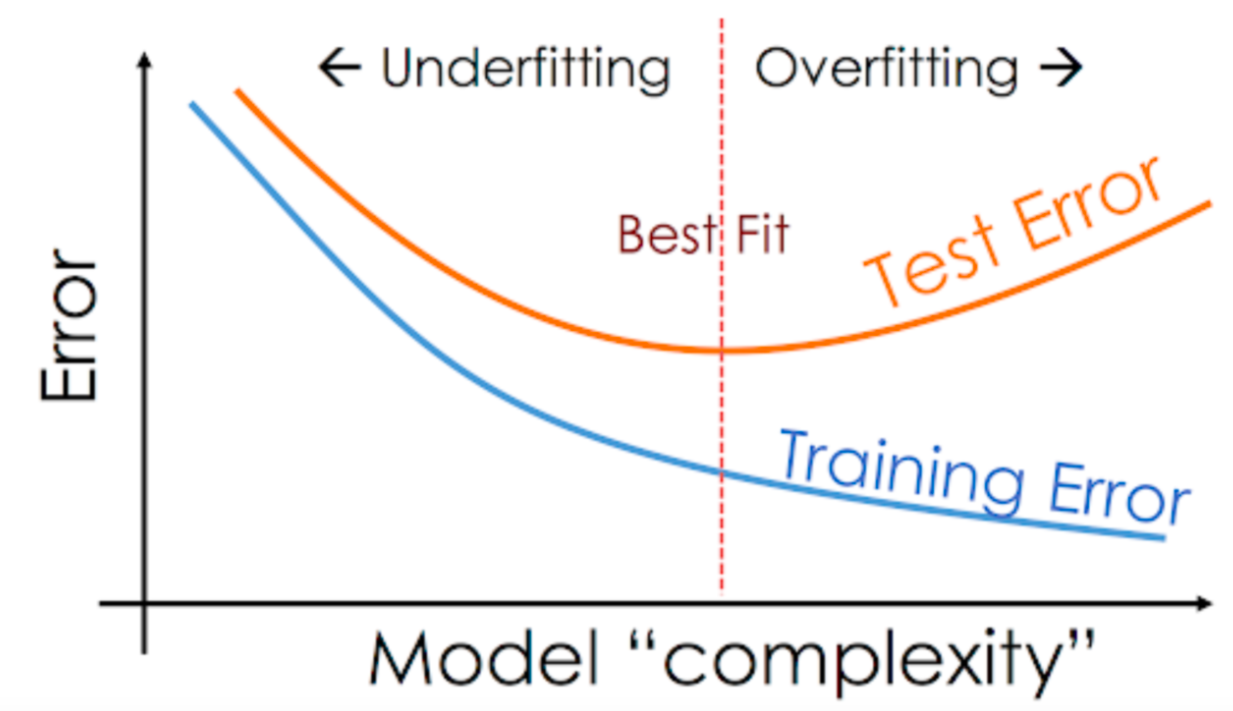
- Underfitting & overfitting: A model is said to be under fitting if both the training and the test / generalization error is sufficiently high. A model is said to be overfitting if there is a large gap between training and test error with test error significantly higher than the training error. An under fitting model tends to have high bias. An overfitting model tends to have high variance. You can read more about under fitting and overfitting in this post – Overfitting and underfitting concepts and interview questions. The diagram below represents the aspect of overfitting and underfitting vis-a-vis model complexity.
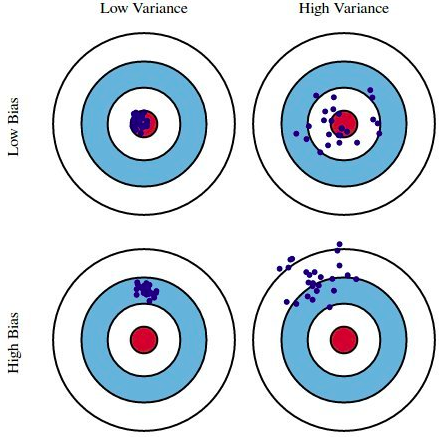
- Bias & variance: A model is said to be biased (high bias) if the model accuracy is low. A model is said to have high variance if multiple models trained on the training data set derived from the same population make significantly different predictions given the input data set. The idea scenario for the model is to have low bias and low variance. However, that is not possible realistically speaking. Thus, an attempt to find sweet spot is made where the model has decent value of bias and variance. You can read more about bias and variance concepts on this page – Bias and variance concepts and interview questions. The dartboard diagram given below can be used to understand the bias and variance concepts. The red dot at the centre represents the true or target value. The blue dots represents the prediction of multiple models trained using different training dataset/features/hyper parameters while data is derived from the same population.
- Confidence interval: Confidence interval is used to estimate the parameters such as mean, median, etc for the population based on the confidence level. Often, the samples are used to find statistics such as mean, median, etc. However, in order to estimate the population parameters from the values derived from the samples, the confidence interval is used. The confidence interval can be used for both proportions as well as numerical values such as mean/median. Read further details on my post – Why confidence intervals in the machine learning?
- Model performance evaluation metrics: Machine learning models’ predictions are compared with the true value and the error is calculated if the prediction and true values don’t match. This process is called as model performance evaluation. There are different metrics used to measure the model performance based on the type of problems such s regression, classification, clustering etc. For regression models, the metrics such as R-Squared, mean squared error etc are used. For classification models, metrics such as accuracy score is used. The primary reasons why model performance would need to be evaluated are some of the following:
- Assess how well each of the models estimates or make predictions or generalizes on unseen or future data set
- Tweak one or more machine learning algorithms (hyper parameters), features etc with an aim to increase the predictive performance of the model
- Select the most appropriate machine learning algorithm out of all and select the most appropriate model from that algorithm hypothesis space
- Supervised learning: Supervised learning is an approach to fitting machine learning models where the models is trained based on input data set and associated label with each training dataset. For example, let’s say there is a problem related to deduction management in account receivables domain where a deduction claimed by the buyer is a valid deduction or invalid deduction. This is a supervised learning problem where the training data will comprise of deduction related features (attributes) and an associated label with each deduction representing whether a given deduction is a valid or invalid deduction. Regression and classification problems can be solved using supervised machine learning approach.
- Unsupervised learning: Unsupervised learning is an approach to fitting machine learning models where the models is trained based on input data set but without associated label as like supervised learning. One of the most common problem which can be solved using unsupervised learning approach is segmentation problem. For example, customer segmentation.
- Regression: Regression represents machine learning algorithms which are used to train the models which predicts numerical values. You may want to read examples of regression problems on this page – Linear regression real-life examples
- Classification: Classification represents machine learning algorithms which are used to train the models which classifies data in binary classes or multiple classes. The model classifying data in binary form is called as binary classification model. The model classifying data into multiple classes is called multinomial classification model. You may want to read examples of classification problems on this page – Classification problems real-world examples
- Clustering
- Reinforcement learning
- Predictive & prescriptive analytics: In predictive analytics, the model is trained using historical / past data based on supervised, unsupervised, reinforcement learning algorithms. Once trained, the new data / observation is input to the trained model. The output of the model is the prediction (what will happen in future) in form of regression (numerical estimate), classification (binary or multi-class classification), clusters (segmenting the data in groups based on similarity) etc. In prescriptive analytics, one or more mathematical algorithms are applied on the outcomes of predictive analytics predictions and business goals, and, the best solution is recommended. You may want to check out this post to read further details – Difference between predictive and prescriptive analytics

Check out my latest book titled as First Principles Thinking: Building winning products using first principles thinking.
- Mathematics Topics for Machine Learning Beginners - July 6, 2025
- Questions to Ask When Thinking Like a Product Leader - July 3, 2025
- Three Approaches to Creating AI Agents: Code Examples - June 27, 2025
I found it very helpful. However the differences are not too understandable for me