In this post, you will learn about the statistics concepts of confidence intervals in relation to machine learning models with the help of an example and Python code examples. You will learn about how to interpret confidence intervals, what are formulas for confidence intervals with the help of examples.
When you get a hypothesis function by training a machine learning classification model, you evaluate the hypothesis/model by calculating the classification error. The classification error is calculated on the sample of the data used for training the model. However, does this classification error for the sample (sample error) also represent (same as) the classification error of the hypothesis/model for the entire population (true error)? How can the true error be represented as a function of the sample error? This is where the concept of confidence interval comes into the picture. You may want to check one of my related posts on true and sample error – The difference between true and sample error.
What is Confidence Interval?
The confidence interval is used to represent the interval or range of values needed to match a confidence level for estimating the parameters of the entire population such as mean or proportion. Recall that statistics is about estimating about the population based on one or more samples representative of the population. You may want to check out my related post such as statistics terminologies cheat sheet. When there is a need to estimate about the population parameter, it is considered as a good practice to represent the estimate as a confidence interval. The population parameter generally represents the mean or median and proportion. And, the confidence level is represented using the number such as 98% confidence, 95% confidence etc.
The confidence interval is associated with the confidence level represented using a number, say, N, and termed as an N% confidence interval. N can take values such as 99, 95, 90, etc. An N% confidence interval would mean the following – If an experiment to find the average height of male out of 100 male, is performed for, say, 50 times, the interval in which the average height will fall for 95% of times (45 times) will be between, say, 173 and 179 cm. Thus, a 95% confidence interval for average height will be 173 and 179 cm.
Confidence interval is used to estimate the statistics such as population mean or median (such as mean height shown in the above example), and, population proportion. Here is an example of the population proportion.
Lets understand confidence interval in reference to machine learning model prediction accuracy / error.
The error of a machine learning model prediction is a classic example of proportion. The error can be represented as the proportion of misclassification in prediction done by the model. So, the error found in the model trained on sample data is termed as sample error. The objective is to estimate the true error of the model given population data. This can be represented using a confidence interval. Confidence interval can be used to estimate the true error of the machine learning model as a function of the margin of error or standard error. Note that margin of error can be represented as function of product of critical t-value or z-value and standard error whose formula is determined based on the usage of critical t-value or z-value.
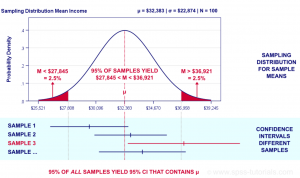
Here is a diagram which can be used to understand the confidence interval concepts. The diagram is taken from the website, spss-tutorials.com.
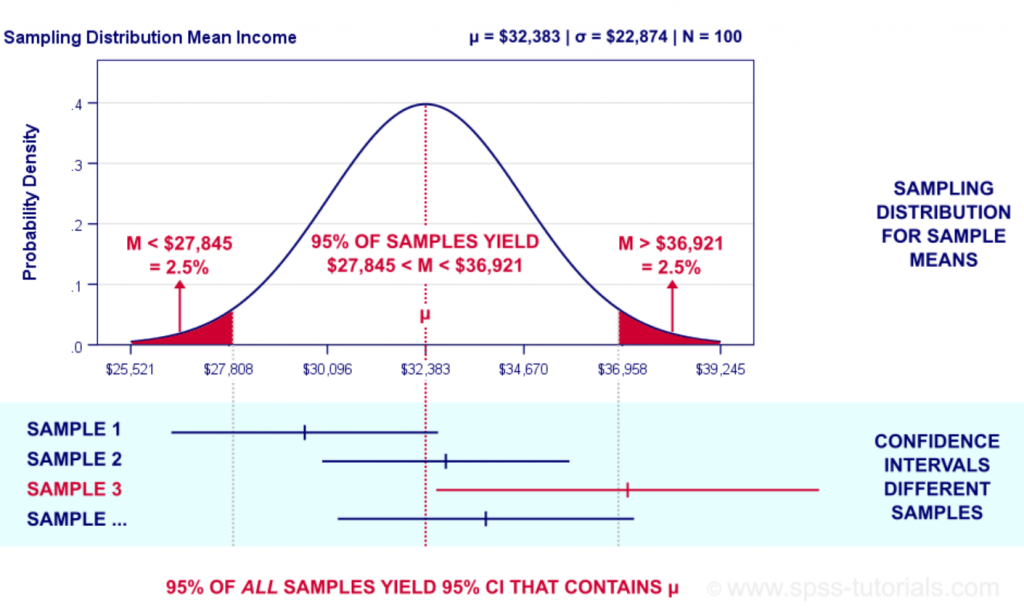
In the above diagram, the ask is to estimate the salary. The mean salary is calculated from different samples (note sample1, sample 2, sample 3, sample 4). The confidence interval for mean salary of the population is $32,383 +/- $4538. This means that the population mean salary would fall between the range of $27845 and $36921 with 95% confidence level.
Why is the confidence interval measurement needed?
Simply speaking, confidence interval measurement is needed to find out the range in which the population parameter will fall based on the outcomes from one or more experiments performed on different samples taken from the population. It is used to communicate the accuracy of the estimate of the population parameters. For any outcome to be found using the experiments, you are never going to be 100% confident about the population parameter based on the experiments. Thus, you need confidence intervals to represent the range in which the population parameter will fall. If you’re 95% confident, that’s usually considered “good enough” in statistics. That percentage of confidence determines the confidence interval. For the N% confidence interval, we are saying that given numerous experiments performed, for N times, the population parameter (P) will fall in the range of P + M and P – M. And, the value of M will change with N. Let’s understand with an example. Confidence intervals are usually reported in the context of a margin of error which is a function of standard error.
Let’s say we want to estimate the mean height of the male population in the 20-30 age group in India. Gathering and calculating the height of every individual in the 20-30 age group in India is a real herculean task. Here the statistics of population parameter is mean height. Is there a way in which we can get a fair estimate of this population parameter, mean height? One of the ways is to take a sample of 1000 male individuals from the key cities, gather their heights, and calculate the mean. The objective is to estimate the mean height of the population based on the mean height calculated from the sample. The estimation of the mean height of population is done using confidence interval. Let’s say the procedure is followed 50 times by taking different samples of 1000 male individuals and the following got observed:
- In 48 times, the mean height fell in the range of 175 and 178 cm. Note that 48 is approx 95% of 50. Thus, with 95% confidence level, one could say that the mean height of the population will be in the range of 175 and 178 cm.
- In 45 times, the mean height fell in the range of 173 and 179 cm. Note that 45 is approx 90% of 50. Thus, with 90% confidence level, one could say that the mean height of the population will be in the range of 173 and 179 cm.
What affects the width of the confidence interval?
The width of the confidence intervals depend upon the following:
- Standard deviation / Variation: Greater is the variation in the population, larger is the width of the confidence interval and vice versa.
- Sample size: Smaller is the sample size, larger is the width of the confidence interval and vice versa. For the smaller sample, the information contained will be less. Thus, there will be larger confidence interval width.
Confidence Interval Formula: How to calculate confidence interval?
Confidence interval can be calculated using a normal distribution (Z-distribution) or T-distribution. T-distribution is used if the sample size is smaller (less than 30) or the standard deviation of the population is not known.
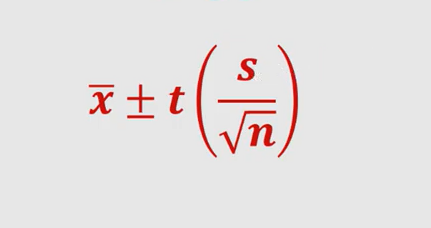
For calculating confidence interval for statistics such as population mean, the following formula can be used. s represents standard deviation of the sample and n represents the size of the sample. [latex]\bar{x}[/latex] bar represents sample mean and t represents t-distribution. T-distribution is used as in most cases the population standard deviation is not known. In case, the population distribution is known in advance and is found to be the normal distribution, one can use standard normal distribution such as z-distribution in place of t-distribution to calculate confidence interval.
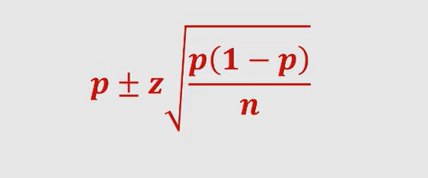
The following formula can be used to calculate confidence intervals for estimating the population proportion. For determining the estimate of the population proportion, the normal distribution is used and, thus, z. p represents the mean proportion of the sample. n represents the size of the sample. If the size of the sample is small (less than 30), one can instead use t-distribution to calculate confidence interval.
Taking above into consideration, one can calculate the true error of the classification model if the sample error for the model is known.
References
Here are some good pages and videos from which the concepts on confidence intervals can be learned:
Here is another great video on the confidence interval.

Check out my latest book titled as First Principles Thinking: Building winning products using first principles thinking.
- Three Approaches to Creating AI Agents: Code Examples - June 27, 2025
- What is Embodied AI? Explained with Examples - May 11, 2025
- Retrieval Augmented Generation (RAG) & LLM: Examples - February 15, 2025
Hello! Great work thanks a lot! Just a small question: “In 48 times, the mean height fell in the range of 175 and 178 cm. Note that 48 is approx 95% of 50. Thus, with 95% confidence level, one could say that the mean height of the population will be in the range of 175 and 178 cm.
In 45 times, the mean height fell in the range of 173 and 179 cm. Note that 45 is approx 90% of 50. Thus, with 90% confidence level, one could say that the mean height of the population will be in the range of 173 and 179 cm.”
Is there any chance that the numbers are the opposite? How is it possible that 48 times the number had tighter spread than 45 times?
Thanks a lot 🙂