Category Archives: Data Structure
Deep Learning – Learning Feature Representations
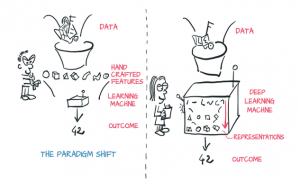
In this post, you learn about what is deep learning with a focus on feature engineering. Here is a quick diagram which represents the idea behind deep learning that Deep learning is about learning features in an automatic manner while optimizing the algorithm. The above diagram is taken from the book, Deep learning with Pytorch. One could learn one of the key differences between training models using machine learning and deep learning algorithms. With machine learning models, one need to engineer features (called as feature engineering) from the data (also called as representations) and feed these features in machine learning algorithms to train one or more models. The model performance …
AI-powered Project Baseline to Map Human Health

In this post, you will learn about technologies and data gathering strategy for Project Baseline, an initiative by Google. Project Baseline is an IOT-based AI-powered initiative to map human health. Different kinds of machine learning algorithms including deep learning etc would be used to understand different aspects of human health and make predictions for overall health improvements and precautionary measures. This would require a very large volume of data to be gathered and processed before being fed into AI models. The following represents the data gathering strategies for Project Baseline: Diagnostic tests covering blood-related tests; specialized tests such as ECG, chest X-ray, eyesight check Doctor examination leading to the collection of data related to health …
Is Blockchain a Linked List like Data Structure?
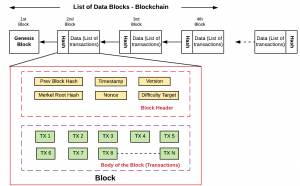
In this post, you will learn about similarity and differences between linked list and Blockchain. The most trivial way to understand What is Blockchain is to visualize Blockchain as a crude form of the Linked List data structure that we read in one of our engineering classes. Simply speaking, a Blockchain can be defined as a linked list of a group of transactions (block) which is connected with each other using hash pointers rather than pointers as in the case of the linked list. The following diagram represents the Linked List data structure: The following diagram represents the Blockchain. Note some of the following characteristics of a block: Each block …
Consistent Hashing Concepts – Databases, DHT
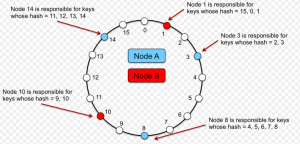
This blog represents What’s The Funda (WTF) around consistent hashing and DHT (Distributed Hash Tables), Databases use cases where it is used. Problems with Traditional Hashing Mechanism Lets understand the traditional hashing mechanism using following diagram: Pay attention to some of the following aspects as per the above diagram: Hash table/map is an array with each of the array index pointing to a linked list having each node representing a key-value pair. Keys are passed through a hash function. The index of the array (bucket) to which a specific key-value pair would get associated is a function of hash value and total size of the array. For example, in above diagram, key such as “Sam …
Learn R – How to Create Density Plot over Histogram
This article represents code examples for overlaying or creating density curve on Histogram using ggplot2 package in R programming. Please feel free to comment/suggest if I missed to mention one or more important points. Also, sorry for the typos. Code Samples to Overlay Density Curve on Histogram In the code examples below, diamonds data set belonging to ggplot2 package is used. One must load the ggplot2 package (require(“ggplot2”)) before executing the code samples given below. # Most simplistic density curve ggplot(diamonds, aes(x=carat)) + geom_histogram(aes(y=..density..)) + geom_density() + labs(title=”Histogram & Density Curve”, x=”Carat”) Following diagram would get displayed by executing the above code. # Density curve with histogram painted using body …
Dummies Notes – What is B-Tree and Why Use Them?
This article represents quick notes on what is B-Tree Data structure and why use them. Please feel free to comment/suggest if I missed to mention one or more important points. Also, sorry for the typos. I found this page (Memory locality & the magic of B-Trees!) on B-Trees as a very interesting read and, would recommend anyone and everyone to go through it to quickly understand the nuances of B-Tree. B-Tree could be defined as a linked sorted distributed range array with predefined sub array size which allows searches, sequential access, insertions and deletions in logarithmic time. Simply speaking, B-Tree is nothing but the generalization of a Binary Search Tree. One may …
I found it very helpful. However the differences are not too understandable for me