Python Tesseract PDF & OCR Example
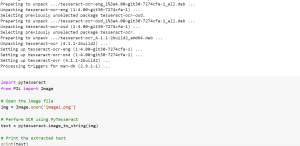
Have you ever needed to extract text from an image or a PDF file? If so, you’re in luck! Python has an amazing library called Tesseract that can perform Optical Character Recognition (OCR) to extract text from images and PDFs. In this blog, I will share sample Python code using with you can use Tesseract to extract text from images and PDFs. As a data scientist, it can be very helpful and useful to be able to extract text from images or PDFs, especially when working with large amounts of data found in receipts, invoices, etc. Tesseract is an OCR engine widely used in the industry, known for its accuracy …
ChatGPT Prompt to get Datasets for Machine Learning
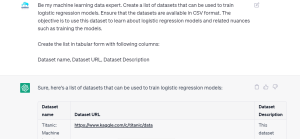
As the field of machine learning continues to expand, having access to high-quality datasets has become increasingly important. Datasets are the foundation of any machine learning project and play a crucial role in determining the accuracy and effectiveness of the resulting model. In this blog post, we will learn about a template ChatGPT prompt that can be used to gather a variety of datasets for different types of machine learning tasks. As data scientists As data scientists, it is recommended that we use a systematic approach to identify and select the right dataset for our machine learning project. This involves considering the specific requirements of our project, such as the …
Gaussian Mixture Models: What are they & when to use?
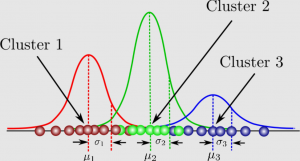
In machine learning and data analysis, it is often necessary to identify patterns and clusters within large sets of data. However, traditional clustering algorithms such as k-means clustering have limitations when it comes to identifying clusters with different shapes and sizes. This is where Gaussian mixture models (GMMs) come in. But what exactly are GMMs and when should you use them? Gaussian mixture models (GMMs) are a type of machine learning algorithm. They are used to classify data into different categories based on the probability distribution. Gaussian mixture models can be used in many different areas, including finance, marketing and so much more! In this blog, an introduction to gaussian …
Python: Convert JSON to CSV Example
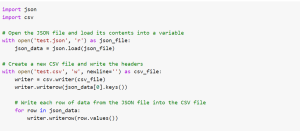
Have you ever wondered how to convert JSON data to CSV using Python? JSON (JavaScript Object Notation) is a popular data format used to exchange data between servers and web applications. However, sometimes it’s necessary to convert this data into another format, such as CSV (Comma Separated Values). CSV is a simple text format that is commonly used to store and exchange tabular data. In this blog post, a sample Python code is provided for converting JSON to CSV using Python. The code showcases the Python code that uses the json and csv modules to read and write data. But before going forward with the code, let’s take a look …
Seaborn: Multiple Line Plots with Markers, Legend
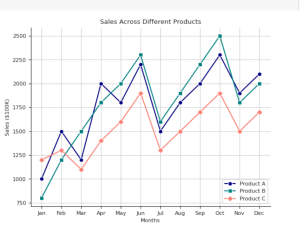
Do you want to learn how to create visually stunning and informative line plots that will captivate your audience by providing most apt information? Do you have the requirement of creating multiple line plots in the same figure representing sales of different products across different months in a year? Are you looking for a takeaway Python code with Seaborn library for creating line plots? If yes, you are in the right place. In this blog post, we’ll explore how to create multiple line plots with Seaborn, a powerful data visualization library built on top of Matplotlib. I will also show how to add markers to the line plots to make …
ChatGPT for Data Science Projects – Examples
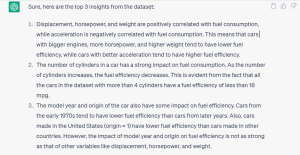
Data science is all about turning raw data into actionable insights and outcomes that drive value for your organization. But as any data science professional knows, coming up with new, innovative ideas for your projects is only half the battle. The real challenge is finding a way to turn those ideas into results that can be used to drive business success by doing proper data analysis and building machine learning models using most appropriate algorithms. Unfortunately, many data science professionals struggle with this second step, which can lead to frustration, wasted time and resources, and missed opportunities. That’s where ChatGPT comes in. As a language model trained by OpenAI, ChatGPT …
Hypothesis Testing in Business: Examples
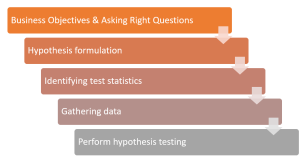
Are you a product manager or data scientist looking for ways to identify and use most appropriate hypothesis testing for understanding business problems and creating solutions for data-driven decision making? Hypothesis testing is a powerful statistical technique that can help you understand problems during exploratory data analysis (EDA) and identify most appropriate hypotheses / analytical solution. In this blog, we will discuss hypothesis testing with examples from business. We’ll also give you tips on how to use it effectively in your own problem-solving journey. With this knowledge, you’ll be able to confidently create hypotheses, run experiments, and analyze the results to derive meaningful conclusions. So let’s get started! Before going …
NLP: Huggingface Transformers Code Examples

Do you want to build cutting-edge NLP models? Have you heard of Huggingface Transformers? Huggingface Transformers is a popular open-source library for NLP, which provides pre-trained machine learning models and tools to build custom NLP models. These models are based on Transformers architecture, which has revolutionized the field of NLP by enabling state-of-the-art performance on a range of NLP tasks. In this blog post, I will provide Python code examples for using Huggingface Transformers for various NLP tasks such as text classification (sentiment analysis), named entity recognition, question answering, text summarization, and text generation. I used Google Colab for testing my code. Before getting started, get set up with transformers …
Sklearn Algorithms Cheat Sheet with Examples

The Sklearn library, short for Scikit-learn, is one of the most popular and widely-used libraries for machine learning in Python. It offers a comprehensive set of tools for data analysis, preprocessing, model selection, and evaluation. As a beginner data scientist, it can be overwhelming to navigate the various algorithms and functions within Sklearn. This is where the Sklearn Algorithms Cheat Sheet comes in handy. This cheat sheet provides a quick reference guide for beginners to easily understand and select the appropriate algorithm for their specific task. In this cheat sheet, I have compiled a list of common supervised and unsupervised learning algorithms, along with their Sklearn classes and example use …
Andrew Ng & OpenAI ChatGPT Prompt Engineering Course
Renowned artificial intelligence (AI) experts, Andrew Ng from DeepLearning.ai and Isa Fulford from OpenAI, have teamed up to offer an exciting new course on prompt engineering, titled “ChatGPT Prompt Engineering for Developers“. The course, which is completely free, aims to help developers better understand the prompts design and implementation for various use cases. The ChatGPT Prompt Engineering course is specifically tailored for developers including data scientists who wish to learn more about designing prompts for different tasks including software development (coding), marketing, creating product reviews & description, writing essay, summarizing text etc. It includes several important topics such as summarizing, inferring, transforming, expanding and chatbot building. These skills are essential …
Supervised & Unsupervised Learning Difference
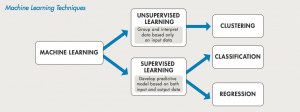
Supervised and unsupervised learning are two different common types of machine learning tasks that are used to solve many different types of business problems. Supervised learning uses training data with labels to create supervised models, which can be used to predict outcomes for future datasets. Unsupervised learning is a type of machine learning task where the training data is not labeled or categorized in any way. For beginner data scientists, it is very important to get a good understanding of the difference between supervised and unsupervised learning. In this post, we will discuss how supervised and unsupervised algorithms work and what is difference between them. You may want to check …
Machine Learning: Inference & Prediction Difference
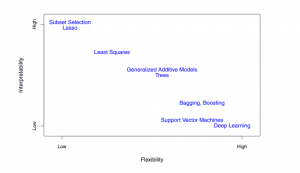
In machine learning, prediction and inference are two different concepts. Prediction is the process of using a model to make a prediction about something that is yet to happen. The inference is the process of evaluating the relationship between the predictor and response variables. In this blog post, you will learn about the differences between prediction and inference with the help of examples. Before getting into the details related to inference & prediction, let’s quickly recall the machine learning basic concepts. What is machine learning and how is it related with inference & prediction? Machine learning is about learning an approximate function that can be used to predict the value …
Sklearn Neural Network Example – MLPRegressor
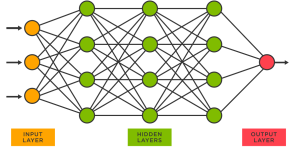
Are you interested in using neural networks to solve complex regression problems, but not sure where to start? Sklearn’s MLPRegressor can help you get started with building neural network models for regression tasks. While the packages from Keras, Tensorflow or PyTorch are powerful and widely used in deep learning, Sklearn’s MLPRegressor is still an excellent choice for building neural network models for regression tasks when you are starting on. Recall that Python Sklearn library is one of the most popular machine learning libraries, and it provides a wide range of algorithms for classification, regression, clustering, dimensionality reduction, and more. In this blog post, we will be focusing on training a …
Neural Networks Interview Questions – Quiz #45

Are you preparing for a job interview in the field of deep learning or neural networks? If so, you’re likely aware of how complex and technical these topics can be. In order to help you prepare, we’ve put together a list of common neural network interview questions and answers in form of multiple-choice quiz. The quiz in this blog post covers basic concepts related to neural network layers, perceptron, multilayer perceptron, activation functions, feedforward networks, backpropagation, and more. We’ve included 15 multiple-choice questions, as well as 5 additional questions specifically focused on the backpropagation algorithm. I will be posting many more quizzes on the neural networks in time to come, …
Google’s Free Machine Learning Courses: Learn from the Best

Machine learning has become a fundamental part of almost every industry today. With the increasing demand for data scientists and machine learning engineers, it has become imperative for professionals to keep themselves updated with the latest tools and techniques. Fortunately, Google offers a range of free machine learning courses that cater to professionals of all expertise levels. In this blog, we will explore the top Google machine learning courses that will help learners enhance their skills and stay ahead of the game. List of Free Machine Learning Courses by Google The following is a list of free machine learning courses from Google which you can take online. These courses can …
ChatGPT Prompts for Focused Learning

Have you ever felt frustrated with the limited time you have to learn and understand key concepts or topics in your desired field in a focused manner? Do you feel lost with the technical terms and jargon used in the desired field? ChatGPT’s prompts can help you overcome these obstacles and make learning more efficient and effective. By leveraging the power of natural language processing and machine learning, ChatGPT provides you with personalized learning opportunities that cater to your specific needs and learning goals. Through this blog, we will explore a list of ChatGPT prompts which can help you learn about any topics in your desired field of interest in …

I found it very helpful. However the differences are not too understandable for me