Data-driven decision-making is a data-driven approach to making decisions to achieve desired outcome. More precisely, data-driven decision making is an insights-driven approach to drive decisions and related actions. The data can come from internal and external data sources to avoid data biases. Data-driven decision-makers use data in their decision process to validate existing actions or take new actions (predictive or prescriptive analytics). They make decisions based on the actionable insights generated from the data. The goal is to make informed decisions while ensuring trust & transparency across the stakeholders & organization as a whole. It can be noted that data-driven decision making provides great thrust to digital transformation initiatives. In this blog post, we will discuss what data-driven decision-making is, how it differs from other types of decision-making, and why you should consider going for this method in your business!
Before we dive in and understand what is data-driven decision-making, lets understand what are first principles of decision-making? What are different forms of decisions?
What is decision making & how does it impact the business?
Decision making can be defined as an act of choosing among competing actions to attain specific objectives. Each of the competing actions (can also be termed as levers) may have one or several consequences (output) that impact our business outcomes. At the time of decision making, we don’t know for certain as to what will be the consequence out of all consequences due to the action performed. The decision is made under conditions of uncertainty. This uncertainty is dealt by leveraging AI / machine learning. The consequences and business outcomes are measured using leading and lagging KPIs respectively. The following picture represents anatomy of decision making and its relationship with business impact:
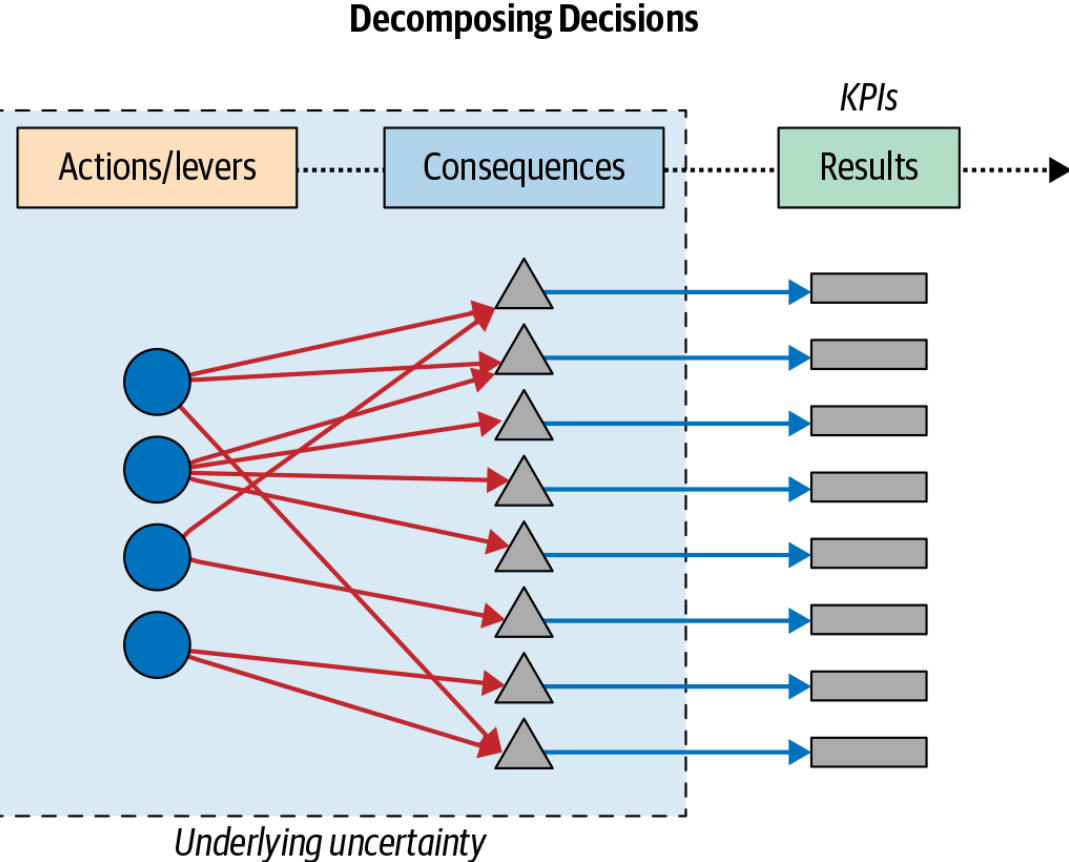
Making great decisions result in great outcomes which result in value creation (revenue, reputation, etc.) for the business. When starting to solve a business problem, it is recommended to identify the key business decisions which can result in best possible outcomes. The decisions should then result in selection of one or more actions which would result in a set of consequences (output) which would finally result in attaining the business objective.
What is data-driven decision-making?
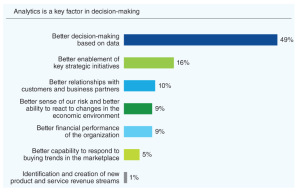
Data-driven decision-making is an approach to problem solving where a well-defined set of actions are driven by decisions which are further driven by insights (extracted from data) derived from the analytics solutions. In the above picture, the actions are chosen based on the insights / evidences provided by the data. Identifying the business problems and appropriate data analytics solutions holds the key to effective data-driven decision-making. In one of the survey done by Deloitte, nearly half of all respondents assert that the greatest benefit of using analytics is that it is a key factor in better decision-making capabilities. Here is the plot:

In data-driven decision making, one uses data in the decision process and the decisions are made based on the data collected from one or more data sources. The goal is to make informed decisions rather than quick ones. Data-driven decision-making requires different systems to be put in place, such as data collection, data processing, data visualization, etc. The diagram below represents the overall flow of this approach to decision-making and can be used to create a playbook.
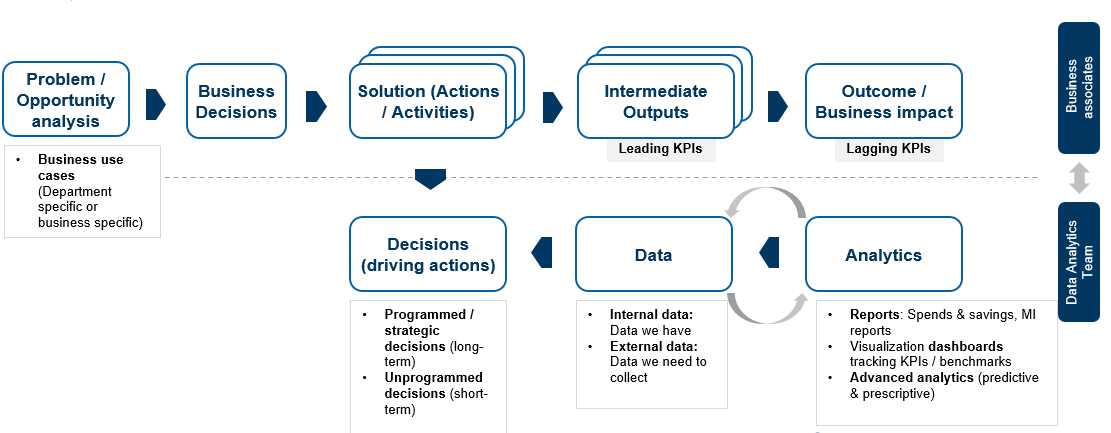
The following represents the key aspects of the playbook related to data-driven decision making:
- Identify problems/opportunities to be dealt with using analytics
- Break down problems into sub-problems for detailed analysis
- Determine the levers in form of data that can be part of the solution to the problem. These levers when pulled can impact the business. Determine the data which can represent these levers. The data can be both internal and external.
- Come up with analytical solutions which can be used to track the hypothesis using KPIs. Dashboards are the most common form of the analytical solution.
- Track the KPIs, take the decision, and act
- Measure the outcome using KPIs
Data-driven decision-making requires defining KPIs, and benchmarks, tracking the KPIs, and driving actions appropriately. KPIs can be of the following different types:
- Business KPIs or Value metrics – These help in measuring the performance of data-driven decision-making systems in relation to the business impact made by data-driven decisions. For example, a revenue growth rate is an indicator of data-driven decision-making because it shows whether decisions are being made to increase sales or not. Business KPIs can also be termed as lagging indicators or lagging KPIs. These KPIs can also be called projects outcome KPIs.
- Customer KPIs – These help in understanding data-driven decision-making from a customer perspective. For example, if the data shows that customers are complaining about an issue and it is not being addressed quickly, then one would need to use this insight and drive actions to address the customer complaints. Customer KPIs can also be termed as leading indicators or leading KPIs.
- Project output KPIs: Project output KPIs are data-driven decision-making KPIs that are used to measure the success of projects. Examples of project output KPIs include the number of user stories completed on time, system availability, system performance, etc.
How to go about creating a system that facilitates data-driven decision-making?
The following are some of the key systems that are required to be deployed in order to facilitate data-driven decision making:
- Data collection or ingestion: The data collection systems enable the data analysts/scientists to capture data points that are required for analysis. The data should be captured in a way that it is not biased towards any particular outcome, and can be used by anyone who has an access to data. Example of data ingestion systems includes data ingestion using data pipelines, data warehouses, etc.
- Data consolidation: Data consolidation is the process of integrating data from multiple data sources into a single repository. Data consolidation can be used for a variety of purposes, including data analysis and decision making. It can help to improve the accuracy of data analytics by providing a more complete picture of the data. Data consolidation can be done manually or through automated means. Automated data consolidation can be done through data Integration tools, which are software that helps to automate the process of data consolidation.
- Tagging and annotation: Tagging allows the analysts/scientists to annotate each data point with a set of tags that provide enough details about the data point for use by other analytics professionals. The tagging system should be easy to use so as not to interrupt workflow processes across teams/organizations. At the same time, data points should be tagged with the most appropriate tags.
- Data processing: The data collected would need to be processed so that it can be used for decision-making. This is where data processing systems come into the picture. Example of data processing systems includes big data processing engines such as Hadoop, and data processing tools like R and Python for data analysis.
- Data visualization: The data analysts/scientists would need to figure out the data insights required for decision-making, and how they can be used by business leaders. This is where data visualization comes in place which enables visualization experts to share insights with the stakeholders through visually appealing graphs, charts, plots, etc. This is where tools such as the Qliksense dashboard comes into the picture.
- Decision model: Data scientists would come up with the decision models which can be used by business stakeholders to make data-driven decisions. An example of a decision model includes the deployment of predictive analytics systems for data-driven decisions.
What are the different types of decisions?
The following represents different forms of decisions made in an organization on a day-to-day basis which can leverage data-driven decision making.
- Programmed decisions: Programmed decisions are the decisions that are taken primarily based on experience or analysis done on the past data in order to perform well-defined actions and achieve a desired business outcome. Subject matter experts (SME), also known as domain experts, data analysts, data scientists and business analysts play a key role in taking programmed decisions. Data analysts / data scientists play an important role in performing exploratory analysis and extracting insights from the historical & current data set. These decisions become part of decisions-actions-impact hypothesis and results in actions which are tracked over a period of time using key performance indictors (KPIs). Check out this post on leading and lagging KPIs – concepts & examples. The programmed decisions can also be understood as long-term decisions that can span over several months or years and often form part of business strategy. Programmed decisions can primarily leverage descriptive and diagnostic analytics tools & methodologies for measuring the impact resulting from actions, based on KPIs & benchmarks. Descriptive analytics is a form of analytics that aims to describe what has happened in past, and, the current state of the business based on ongoing initiatives as part of business strategy. In simpler words, descriptive analytics helps understand what has happened. Similarly, diagnostic analytics is a form of analytics that helps in diagnosing the problem. It helps answer question such as why does the problem exist? What are the levers that can be used to have an impact on the outcomes?
The impact of programmed decisions can be tracked using the descriptive and diagnostic analytics that can leverage tools such as dashboards. The dashboards can be made using Excel or visualization tools such as Qliksense, Tableau, etc. The dashboards can be built by consolidating data from different sources including internal and external data sources. The dashboards help track actions using KPIs & benchmarks. The dashboards can be institutionalized later into organization appropriately. Programmed decisions can also be termed as policy decisions at times as this results in long-term policy definition and implementation.
The following represents different examples of programmed decisions:- Marketing decisions: Marketing decisions can be a type of programmed decisions which can be made for a given time period and the impact can be measured by tracking KPIs in order to measure the impact on sales. Let’s understand with one example. Let’s say the decision hypothesis is – Continue to invest in digital marketing as it provides better result than traditional methods of marketing. In order to test the hypothesis, the actions related to digital marketing would need to be performed and the outcome of digital marketing would need to be measured. The KPIs / benchmarks and related data needs to be determined related to different forms of digital marketing and the same needs to be tracked on the dashboard. Some of the following questions can be answered using the dashboard (descriptive analytics):
- Can the investment in digital marketing be increased based on KPIs trends against the benchmark?
- What form of digital marketing should be adopted for maximum gains?
- When can we decide to opt for more traditional methods? What values of KPIs will indicate that?
- What should be split in the digital and traditional form of marketing?
- Marketing decisions: Marketing decisions can be a type of programmed decisions which can be made for a given time period and the impact can be measured by tracking KPIs in order to measure the impact on sales. Let’s understand with one example. Let’s say the decision hypothesis is – Continue to invest in digital marketing as it provides better result than traditional methods of marketing. In order to test the hypothesis, the actions related to digital marketing would need to be performed and the outcome of digital marketing would need to be measured. The KPIs / benchmarks and related data needs to be determined related to different forms of digital marketing and the same needs to be tracked on the dashboard. Some of the following questions can be answered using the dashboard (descriptive analytics):
- Unprogrammed decisions: These are short-term decisions that need data to be analyzed in order to make a decision. Unprogrammed decisions, at times, can also be termed as tactical and/or operational decisions. Unprogrammed decision can leverage predictive and prescriptive analytics. Here is an example of an unprogrammed decision that leverages predictive modeling or machine learning modeling. For example, let’s say a predictive model is built to classify whether a customer will churn or otherwise. The predictive model provides a probability score against each customer. Businesses can decide to send a marketing campaign with new offerings to all customers whose probability score is more than 0.8. In another decision, it can decide to send out a campaign email if the score is greater than 0.9. You may note that these decisions are unprogrammed and can vary depending upon the decision points from the predictive model. Data-driven decision-making helps in reaching better conclusions than human intuition. For example, the following are different types of unprogrammed decisions:
- Sales manager’s daily sales report: What customers should I focus on? Which customer can give maximum revenue for me this month?
- Marketing manager’s daily data report: What are the best strategies to increase my company’s Facebook followers?
- Manufacturing decisions can also be seen as unprogrammed decision. These decisions can leverage output of prescriptive analytics to arrive at the decision points. For example, what should be the optimal manufacturing capacity to meet the increase in demand?
- Organizational decisions: These are data-driven decisions that need data to arrive at the correct decision. These data can be used by multiple people in an organization and they will make similar types of unprogrammed or programmed decisions based on them. For example, the following are different types of organizational decisions:
- Industry benchmarking data – How is my company comparing to others in the same industry?
- Market data – How much demand is there for our products/services in the marketplace? Are they increasing or decreasing over time?
- Strategic decisions: These data-driven decisions are used to make long-term planning in the organization. For example, the following are different types of strategic data-driven decisions:
- Strategic plan – Where do we want to be in five years? What should our company’s mission statement be?
- Long term data collection for programmed decisions – Whether a new data-collection system is required to record data over a long period
Benefits of data-driven decision-making
The following are different benefits or advantages of data-driven decision-making.
- Enable organizations to adopt analytical approach to problem solving
- Enable organizations to adopt value-centric approach to problem solving by leveraging actionable insights
- Helps organizations go digital by enabling stakeholders to make informed decisions in a timely manner based on actionable insights, and gain a competitive edge with greater speed, agility, and scale (SAS).
- Faster, better & informed decisions: Better business decisions are made by considering both data and human intuition, which leads to better results for companies. It reduces the bias introduced due to gut feeling.
- Increased data visibility: Data-driven decision-making helps in increasing data transparency as the data is available to multiple people and it can be easily shared.
- Increased data accessibility: Data-driven decision-making helps in creating data access for everyone, not just a single person or department. This leads to increased data sharing and reduces the chances of mistakes being made due to a lack of information.
- Increased data quality: Data-driven decision-making ensures data quality is increased by removing data redundancy and errors. This leads to more accurate data collection and higher precision in the analysis of the data.
- Efficient use of time: With data-driven decision-making, companies can save on time and resources as human input and associated risks are reduced significantly.
- Increased data usage: Data-driven decision-making ensures data is used in a better way, for example, data can be easily shared and reused. This leads to increased data value as more people use the same data which increases its worth over time.
- Enhanced data-literacy: Data-driven decision-making helps data professionals to improve their data literacy skills, which in turn will lead them towards better career opportunities.
- Increased customer satisfaction: When multiple data points are collected about customers, companies can come up with various ways to increase their overall satisfaction levels which will lead to increased retention rates and ultimately better future revenue for the company.
Risks associated with data-driven decision-making
The following are risks or disadvantages of data-driven decision making:
- Confirmation bias: Confirmation bias is a cognitive bias that refers to our tendency to search for, interpret, or remember information in a way that confirms our preexisting beliefs. This bias can lead us to ignore contradictory evidence, or to interpret it in a way that reinforces our existing views. Confirmation bias can have a significant impact on the outcome of data analytics projects. For example, if a data analyst has a strong prior belief about which factors are most important in predicting customer behavior, they may be more likely to pay attention to data that supports this view, and to discount evidence that contradicts it. As a result, confirmation bias can lead to inaccurate conclusions and suboptimal decision-making. To avoid these pitfalls, analysts need to be aware of their own biases and make an effort to seek out contradictory evidence. By taking these steps, they can help ensure that their conclusions are based on sound data analysis rather than confirmation bias.
- Data leakage: Data leakage is the unauthorized disclosure of data. Data leaks can occur when data is transferred from one location to another, or when data is accessed by unauthorized individuals. Data leaks can have serious consequences, including loss of customer trust, financial loss, and damage to an organization’s reputation.
- Data bias: Data bias is a form of error that occurs when data is collected or analyzed in a way that favors a particular outcome. Data bias can occur at any stage of the data collection and analysis process, from the design of the survey to the interpretation of the results. Data bias can have a number of causes, including confirmation bias, self-selection bias, and survivorship bias. Data bias can lead to inaccurate conclusions about trends and patterns in the data, and it can be difficult to detect. Data analytics techniques, such as data cleansing and outlier detection, can help to identify and correct data bias. However, data bias is an inherent limitation of all forms of data analysis, and it is important to be aware of its potential impact on conclusions.
- Unforeseen consequences: The data analysts/scientists fail to take into account other factors such as data quality, data collection errors, etc. while coming up with data insights which can lead to unforeseen consequences in the future because of wrong data analysis.

Check out my latest book titled as First Principles Thinking: Building winning products using first principles thinking.
- Questions to Ask When Thinking Like a Product Leader - July 3, 2025
- Three Approaches to Creating AI Agents: Code Examples - June 27, 2025
- What is Embodied AI? Explained with Examples - May 11, 2025
I found it very helpful. However the differences are not too understandable for me