A dashboard is a visual representation of the most important information needed to achieve a goal. Dashboards form an integral part of analytical solutions. As the demand for data analytics continues to grow, dashboards are well-positioned to become one of the most essential tools in any business toolkit. It can provide an overview of what is happening in your business and help you make better decisions. While there are many advantages to using a dashboard, there are also some disadvantages that you should be aware of. In this blog post, we will discuss the purpose of the dashboard and its advantages and disadvantages. As a product manager/business analyst and data science architect, you must get a good understanding of when to use dashboards.
What is a dashboard and what is its purpose?
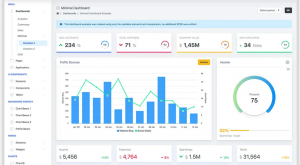
A dashboard is a visual display of data and information that is typically used to provide an overview of a company or organization’s performance. Simply speaking, dashboards can be said to be digital tools that help users to see and understand data. The purpose of a dashboard is to help users quickly understand the current state of affairs by providing a high-level view of key metrics including value metrics and key performance indicators (KPIs). Dashboards are often used in conjunction with analytics tools to help users drill down into the underlying data to identify trends, benchmark performance, and make informed decisions. Dashboards can be customized to display the specific data and information that is most relevant to the user, making them an invaluable tool for business intelligence. A dashboard may look like the following:

Dashboards typically consist of a series of charts, graphs, and other data visualizations that are easy to interpret at a glance. While dashboards vary in design and functionality, their ultimate purpose is to provide users with a quick and easy way to understand complex data sets.
When to use dashboards?
Dashboards can be used to test hypotheses, track progress towards goals, and spot early warning signs of issues. They can also be used to monitor key performance indicators (KPIs) in real-time, identify areas of improvement, and make decisions that will help you achieve your desired outcomes.
The following is a playbook for coming up with appropriate dashboards:
- Understand business problems well. You can get a good understanding of the business problems by breaking down the problem into subproblems. Ensure to talk to actual users who can tell you greater details about the problem/opportunity.
- Formulate hypotheses as part of analytical solution approaches
- Validate hypotheses by examining data
- Design KPIs related to hypotheses
- Design and create dashboards for tracking those KPIs
Check out a related post on how to identify AI / machine learning use cases.
What are the advantages of using a dashboard?
Dashboards are a popular tool for visualizing data and presenting information in a clear and concise way. Dashboards have several advantages over other types of data visualization, including the ability to see multiple metrics at a glance, customize the layout to fit specific needs, and drill down into the data for more granular analysis. The following are some of the advantages of using dashboards:
- Decision-making aid: Dashboards can be used to track progress, monitor and spot trends over time, provide valuable insights into customer behavior and market changes, and make better decisions.
- Identify business opportunities: By bringing together key data points and metrics, they provide a quick and easy way to track progress and identify areas of opportunities.
- Easy to share: Dashboards make it easy to share information with others, whether it’s through email, social media, or embedding the dashboard on a website. Dashboard screenshots can be easily used in PowerPoint presentations.
- Business & personal usage: Dashboards can be used for both business and personal use.
What are the disadvantages of using a dashboard?
Dashboards are a popular tool for data visualization, but they have some distinct disadvantages.
- Dashboards can be overwhelming, particularly if they try to pack in too much information. It can be difficult for users to know where to look and what is most important.
- Dashboards are often static, meaning that they don’t update in real-time as data changes. This can make them less useful for tracking fast-moving trends.
- Dashboards can get difficult to customize, meaning that users may not be able to tailor them to their specific needs. For these reasons, dashboards should be used carefully and only when they offer the best way to visualize the desired data.
- Dashboards can also be misleading if they are not used correctly. It is easy to cherry-pick data (data bias) that supports a particular argument while ignoring data that does not. This is also called confirmation bias. As a result, dashboards should be used carefully and only as one part of a broader analytical approach.
Technologies for creating the dashboards
Dashboards are a vital tool for any business, offering a clear and concise way to monitor key performance indicators (KPIs). There are a number of different technologies and tools available for creating dashboards, ranging from simple Excel spreadsheets to complex data visualization software. The right solution for your business will depend on a number of factors, including the amount and complexity of data, the need for real-time updates, and the budget. However, there are a few key considerations that all businesses should keep in mind when choosing a dashboard solution.
- It is important to ensure that the solution can connect to all relevant data sources.
- It is essential to select a solution that offers flexibility and customization options so that the dashboard can be tailored to the specific needs of the business.
- It is worth considering a cloud-based solution, as this will offer greater scalability and allow access from anywhere.
By keeping these factors in mind, you can be sure to select the best possible technology for your business needs. The following are some of the data visualization software that can be used for creating a dashboard. Each of the below tools has its own advantages and disadvantages that should be considered before selecting the right solution for your business.
- Tableau: Tableau is a powerful tool that offers a great deal of flexibility and customization options. However, it can be expensive and requires a certain level of technical expertise.
- Google Data Studio: Google data studio is a free tool that is easy to use and doesn’t require any technical expertise. However, it can be limited in terms of customization options.
- Microsoft Power BI: Microsoft Power BI is a tool that offers a good balance between price and features. It is relatively easy to use and offers a good selection of customization options.
- Klipfolio: Klipfolio is a tool that is designed specifically for dashboard creation. It offers a good range of features and is relatively easy to use. However, it can be expensive.
- Geckoboard
- Datapine
- Qliksense
Conclusion
Dashboards are a popular tool for data visualization because they offer a number of advantages. They can be used to monitor key performance indicators, and they offer a clear and concise way to visualize data. Additionally, they can be customized to fit the specific needs of the business, and they offer flexibility in terms of connecting to different data sources. However, the dashboard also has some disadvantages. They can be overwhelming for users, and they can be difficult to customize. Additionally, the dashboard can be misleading if not used correctly. For these reasons, it is important to carefully consider the purpose of the dashboard before selecting a solution.

Check out my latest book titled as First Principles Thinking: Building winning products using first principles thinking.
- Completion Model vs Chat Model: Python Examples - June 30, 2024
- LLM Hosting Strategy, Options & Cost: Examples - June 30, 2024
- Application Architecture for LLM Applications: Examples - June 25, 2024
Leave a Reply