In this post, we will learn Hypergeometric distribution with 10+ examples. The following topics will be covered in this post:
- What is Hypergeometric Distribution?
- 10+ Examples of Hypergeometric Distribution
If you are an aspiring data scientist looking forward to learning/understand the binomial distribution in a better manner, this post might be very helpful.
The Binomial distribution can be considered as a very good approximation of the hypergeometric distribution as long as the sample consists of 5% or less of the population. One would need a good understanding of binomial distribution in order to understand the hypergeometric distribution in a great manner. I would recommend you take a look at some of my related posts on binomial distribution:
What is Hypergeometric Distribution?
The hypergeometric distribution is a discrete probability distribution that describes the number of successes in a sequence of n trials/draws from a finite population without replacement. For a population of N objects containing K components having an attribute take one of the two values (such as defective or non-defective), the hypergeometric distribution describes the probability that in a sample of n distinctive objects drawn from the population of N objects, exactly k objects have attribute take specific value. The key points to remember about hypergeometric experiments are A. Finite population B. Experiments where trials are done without replacement
Consider a population and an attribute, where the attribute takes one of two mutually exclusive states and every member of the population is in one of those two states. For example, the attribute might be “over/under 30 years old,” “is/isn’t a lawyer,” “passed/failed a test,” and so on. Furthermore, the population will be sampled without replacement, meaning that the draws are not independent: each draw affects the next since each draw reduces the size of the population.
In hypergeometric experiments, the random variable can be called a hypergeometric random variable. It is defined in terms of a number of successes. One would need to label what is called success when drawing an item from the sample.
Let’s try and understand with a real-world example. From a consignment of 1000 shoes consists of an average of 20 defective items, if 10 shoes are picked in a sequence without replacement, the number of shoes that could come out to be defective is random in nature. Here, success is the state in which the shoe drew is defective. In one experiment of 10 draws, it could be 0 defective shoes (0 success), in another experiment, it could be 1 defective shoe (1 success), in yet another experiment, it could be 2 defective shoes (2 successes). Thus, in these experiments of 10 draws, the random variable is the number of successes that is the number of defective shoes which could take values from {0, 1, 2, 3…10}
Hypergeometric Random Variable X, in the above example, can take values of {0, 1, 2, .., 10} in experiments consisting of 10 draws.
For calculating the probability of a specific value of Hypergeometric random variable, one would need to understand the following key parameters:
- The population of finite size (N)
- The number of successes in the population (K)
- The number of trials/draws (n)
- The number of observed successes (k)
The probability of drawing exactly k number of successes in a hypergeometric experiment can be calculated using the following formula:
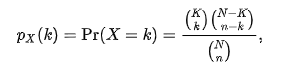
Parameters of Hypergeometric Distribution
[latex]Mean (X) = \frac{nK}{N}[/latex]
[latex]Variance (X) = \frac{nK}{N}(1 – \frac{K}{N})\frac{(N – n)}{(N – 1)}[/latex]
[latex]Standard Deviation (X) = \sqrt{Variance(X)}[/latex]
10+ Examples of Hypergeometric Distribution
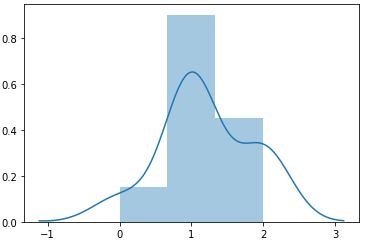
- Deck of Cards: A deck of cards contains 20 cards: 6 red cards and 14 black cards. 5 cards are drawn randomly without replacement. Here, the random variable X is the number of “successes” that is the number of times a red card occurs in the 5 draws. The probability of getting a red card in the first draw is 6/20. However, this probability changes after every draw based on what card appeared so far. Thus, in the second draw, if the red card appears in the first draw, the probability of getting a red card is 5/19. In case, the black card appeared in the first draw, the probability of getting a red card in the second draw is 6/19. The diagram below represents 10 experiments of drawing 5 cards and the probability of occurrence of red card (success)
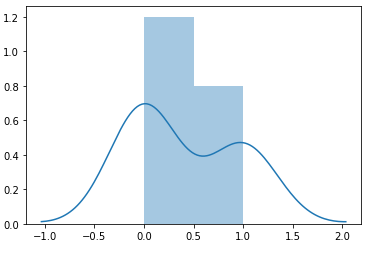
- Inspection for Defective Items: A young, growing company is making products in small lots. An inspector is assigned to do sampling from a particular manufacturing process. So the inspector takes a sample size of n = 5 from a lot size of N = 100 parts, where K = 8 occurrence in the population. Here, the random variable X is the number of “successes” which is the number of defective items. The random variable X could take a value of 0, 1, 2, 3, 4, 5 (k = {0, 1, ..5}) in a sequence of 5 draws (n=5). The diagram below represents 10 experiments of picking a sample of 5 items and the probability of occurrence of the defective item (success)
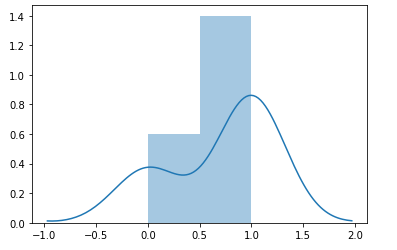
- Companies accepting the order: A company buys batches of N = 1000 components. On average, there are K = 10 items that are found defective. Before a batch is accepted, n = 50 of the components are selected at random from the batch and tested. The batch is rejected if more than k = 3 components in the sample are found to be below standard. Here, the random variable X is the number of “successes” which is the number of defective items found. The random variable X could take a value of 0, 1, 2, 3 (k = {0, 1, ..3}) in a sequence of 50 draws (n=50). The diagram below represents 10 experiments of picking a sample of 50 items and the probability of occurrence of the defective item (success).
- Finding females in a class: In a class consisting of 45 boys and 15 girls, If 10 students are selected one-by-one, what is the probability of finding 4 girls? Here N = 60, K = 15, n = 10 and k = 4. The random variable X is the number of “successes” that is the number of girls found. The random variable X could take a value of 0, 1, 2, 3, 4 (k = {0, 1, ..4}) in a sequence of 10 draws (n=10).
- Selection of a particular type from a group: During a particular period a university’s information technology office received 30 service orders for problems with printers, of which 8 were laser printers, 12 were inkjet models and 10 were older printers. A sample of 5 of these service orders is to be selected for inclusion in a customer satisfaction survey. Suppose that the 5 are selected in a completely random fashion so that any particular subset of size 5 has the same chance of being selected as does any other subset. What then is the probability that exactly k (k = 0, 1, 2, 3, 4, or 5) of the selected service orders were for inkjet printers? Here N = 30, K = 12, n = 5. The random variable X is the number of “successes” that is the inkjet printers are selected. The random variable X could take a value of 0, 1, 2, 3, 4, 5 (k = {0, 1, ..5}) in a sequence of 5 draws (n=5).
- Team selection of 4 girls for the team of 7: A quiz team is to be chosen randomly from 15 boys and 12 girls. The team has 7 slots. The goal is to find out the probability that 4 of the players will be girls. Here N = 27, K = 12, n = 7. The random variable X is the number of “successes” that is the number of girls to be selected. The random variable X could take a value of 0, 1, 2, 3, 4 (k = {0, 1, ..4}) in a sequence of 7 draws (n=7).
- Basket of apples and oranges: In a basket consisting of 20 apples and 15 oranges, what is the probability of selecting 5 oranges after drawing 10 fruit from the basket. Here N = 36, K = 15, n = 10. The random variable X is the number of “successes” that is the number of oranges selected. The random variable X could take a value of 0, 1, 2, 3, 4, 5 (k = {0, 1, ..5}) in a sequence of 10 draws (n=5).
- Students of Foreign origin: In a foreign university comprising of 1000 students out of which 350 are of Indian origin, what is the probability of selecting 5 Indians when 20 students are selected? Here N = 1000, K = 350, n = 20. The random variable X is the number of “successes” that is the number of Indian students selected. The random variable X could take a value of 0, 1, 2, 3, 4, 5 (k = {0, 1, ..5}) in a sequence of 20 draws (n=5).
- Voters for PM Narendra Modi: In a voter list comprising of 3,50,000 voters, there are 40% voters going to vote for PM Narendra Modi. If a random 100 voters are selected, what is the probability of selecting 70 voters of Narendra Modi? Here N = 350000, K = 0.4350000 = 140000, n = 100. The random variable *X** is the number of “successes” that is the number of voters for PM Narendra Modi. The random variable X could take a value of 0, 1, 2, 3, 4, …,70 (k = {0, 1, ..70}) in a sequence of 100 draws (n=100).
- Students of a particular school in inter-school sports meet: In an inter-school sports competition comprising of 10 schools participating with 12 representatives from each school, what is the probability of selecting 3 students from DAV school when a sample 10 students is selected? Here N = 120, K = 12, n = 10. The random variable X is the number of “successes” that is the number of students from DAV school. The random variable X could take a value of 0, 1, 2, 3 (k = {0, 1, 2, 3}) in a sequence of 10 draws (n=10).
- Selection of QA Engineer in a company: In a company of 1000 employees, there are 700 developers, 100 sales & marketing and the remaining QA engineer. What is the probability of selecting 10 QA engineers when a sample of 30 employees is picked up? Here N = 1000, K = 200, n = 30. The random variable X is the number of “successes” that is the number of QA Engineers. The random variable X could take a value of 0, 1, 2, 3, 4, …,30 (k = {0, 1, ..30}) in a sequence of 30 draws (n=30).
References
- Hypergeometric Distribution from math.info
- Hypergeometric Distribution from Brilliant.org
- Hypergeometric Distribution from ScienceDirect.com
- Hypergeometric Distribution examples
- Some great examples of Hypergeometric distribution
- Difference between hypergeometric and negative binomial distribution

Check out my latest book titled as First Principles Thinking: Building winning products using first principles thinking.
- Mathematics Topics for Machine Learning Beginners - July 6, 2025
- Questions to Ask When Thinking Like a Product Leader - July 3, 2025
- Three Approaches to Creating AI Agents: Code Examples - June 27, 2025
I found it very helpful. However the differences are not too understandable for me