Understanding the differences between true error and sample error is an important aspect of data science. In this blog post, we will be exploring the difference between these two common features of statistical inference. We’ll discuss what they are and how they differ from each other, as well as provide some examples of real-world scenarios where an understanding of both is important. By the end, you should have a better grasp of the differences between true error and sample error.
In case you are a data scientist, you will want to understand the concept behind the true error and sample error. These concepts are key to understand for evaluating a hypothesis.
What is a True Error or True Risk?
The true error or true risk of a hypothesis is the probability (or proportion) that the learned hypothesis (machine learning model) will misclassify a single randomly drawn instance from the population. The population simply means all the data taken from the world. Let’s say the hypothesis learned using the given data is used to predict whether a person suffers from a disease. Note that this is a discrete-valued hypothesis meaning that the learned hypothesis will result in the discrete outcome (person suffers from the disease or otherwise).
Mathematically, if the target function is f(x) and the learned hypothesis is h(x), then the true error can be represented as the following:
True Error = Probability [ f(x) is NOT EQUAL TO h(x) ] for any single instance drawn from the population at random.
In other words, True Error can be represented as proportion of misclassification for the entire dataset or population.
Hypothesis h(x) can be used to represent a machine learning model. Note that there can be multiple different hypotheses which can be learned using different hyper-parameter settings, different features, different algorithms, different training data set, etc. And, all possible hypotheses form what is called hypothesis space. Learn about these terminologies from my post – ML Terminologies for beginners. Let’s say that the hypothesis is that function h trained using logistic regression and a particular set of hyperparameters predicts whether a person suffers from a disease given parameter x. Other possible hypotheses can be learned using different machine learning algorithms such as decision tree, random forest, gradient boosting trees, etc.
The true error will then represent the probability that logistic regression-based hypothesis h(x) misclassifies a person suffering from a disease for the entire population. True error is also termed as True Risk.
The question is how to calculate the true error or true risk. This is where sample error or empirical risk comes into the picture. The goal is to understand how good an estimate of true error is provided by the sample error?
What is a Sample Error or Empirical Risk?
The sample error or empirical risk of a learned hypothesis (machine learning model) with respect to some sample S of instances drawn from the population is the fraction of S that it misclassifies. The sample error is also called a sampling error. Intuitively, sample error represents variation in the parameter (such as the mean or proportion) due to sampling.
Let’s say that a sample S consists of 50 instances. Out of 50 instances, 15 are misclassified. Thus, the sample error could be calculated as the following:
Sample error = (count of instances misclassified) / (total count of instances) = 15/50 = 0.3 (30%)
The sample error can also be represented in terms of the following:
[latex]Sample Error = \frac{False Positive + False Negative}{True Positive + False Positive + True Negative + False Negative}[/latex]
The above can also be represented as the following:
[latex]Sample Error = 1 – \frac{True Positive + True Negative}{True Positive + False Positive + True Negative + False Negative}[/latex]
The above can further be represented as the following:
[latex]Sample Error = 1 – Accuracy[/latex]
Confidence Interval – How to Estimate the True Error?
The true error is very complex to be calculated. However, it could be estimated as a function of the sample error given the following assumptions:
- The sample S contains n examples which are drawn independent of one another and also independent of the hypothesis
- Size of the sample is greater than or equal to 30
- Hypothesis h misclassifies r instances out of total n instances
Given the above assumptions, the statistical theory allows the following assertions:
- Given no other information, the most probable value of the true error is the sample error
- With an approximate 95% confidence level, the value of true error lies in the following interval. 1.96 refers to 2 standard deviation, or, z-value = 2.
[latex]SampleError \pm 1.96*\sqrt{\frac{SampleError*(1 – SampleError)}{SampleSize}}[/latex]
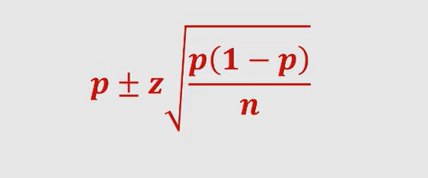
The above means that if the experiment is repeated over and over again, for 95% of experiments, the true error will fall in the interval calculated based on the above formula. Thus, this interval is called a 95% confidence interval estimate for true error. Note that the above formula is similar to confidence interval of estimating the proportion of the population as like the following:
For other value of confidence interval the following table can be used to substitute 1.96 with the appropriate value:
| Confidence Interval N% | Constant (Z-value) |
| 50 | 0.67 |
| 68 | 1.00 |
| 80 | 1.28 |
| 90 | 1.64 |
| 95 | 1.96 |
| 99 | 2.58 |
You may note that as the confidence interval increases, the interval value increases. Intuitively, the idea is to capture all possible values of true error based on the sample error.
The following represents the rule of thumb on whether the true error could be estimated from the sample error
- Sample error rate is not close to zero (0) or one (1)
- SampleCount * SampleError(1 – SsampleError) >= 5
Difference between True Error & Sample Error
The following represents the differences between true error and sample error:
- The true error represents the probability that a randomly drawn instance from the population (distribution) is misclassified while the sample error is the fraction of the sample which is misclassified
- The true error is used for the population while sample error is used for the sample
- True error is difficult to calculate. Thus, the true error is calculated as a function of the sample error. This is where the confidence interval comes into the picture. The confidence interval of true error means what is the range in which the true error will be if the sample error is some X.
References
You may want to check out the following related video to understand about true error, sample error and confidence intervals.

Check out my latest book titled as First Principles Thinking: Building winning products using first principles thinking.
- Mathematics Topics for Machine Learning Beginners - July 6, 2025
- Questions to Ask When Thinking Like a Product Leader - July 3, 2025
- Three Approaches to Creating AI Agents: Code Examples - June 27, 2025
I found it very helpful. However the differences are not too understandable for me