In this post, you will learn about the concepts of RANSAC regression algorithm along with Python Sklearn example for RANSAC regression implementation using RANSACRegressor.
RANSAC regression algorithm is useful for handling the outliers dataset. Instead of taking care of outliers using statistical and other techniques, one can use RANSAC regression algorithm which takes care of the outlier data. In this post, the following topics are covered:
- Introduction to RANSAC regression
- RANSAC Regression Python code example
Introduction to RANSAC Regression
RANSAC (RANdom SAmple Consensus) algorithm takes linear regression algorithm to the next level by excluding the outliers in the training dataset. The presence of outliers in the training dataset does impact the coefficients / parameters learned as part of training. Thus, it is recommended to identify and remove the outliers during exploratory data analysis phase. There are various statistical techniques such as Z-scores, Box plot, other kinds of plots, hypothesis tests etc which can be used for removing outliers from the training data set. However, these statistical tests / techniques are out of scope for this post and will be dealt in one of the future posts.
RANSAC Regression Terminologies
Before getting into understanding the RANSAC regression algorithm, lets understand few terminologies:
- Outliers: Outliers are data which are far from other data points. These data points can be found at both the ends. Meaning, outliers can be way below a certain point which can be termed as minimum or way more than other point which can be termed as maximum. One of the easy way to find outlier is to use boxplot. Here is the box plot created to find out outliers in the housing prices. In the boxplot given below, one can find outliers at both the ends such as minimum and maximum. These are the points which can have adverse impact on coefficients of regression model if not taken care of. In this post, you will learn about how using RANSAC algorithm will exclude outliers from training data used for training the model.
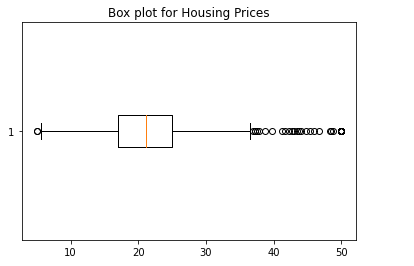
The above box plot can be achieved using the following Python code:
from sklearn import datasets
import matplotlib.pyplot as plt
#
# Load the boston housing dataset
#
bhd = datasets.load_boston()
X = bhd.data
y = bhd.target
#
# Create the box plot
#
fig1, ax1 = plt.subplots()
ax1.set_title('Box plot for Housing Prices')
ax1.boxplot(y, vert=False)
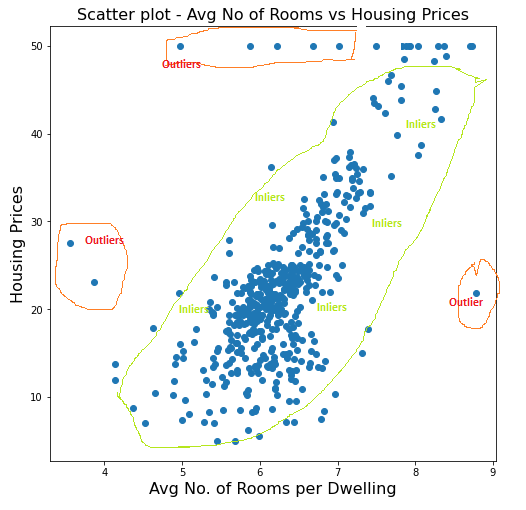
- Inliers: The data which are not outliers can be said as the inliers. Inliers represent the dataset which are used for training the model using algorithm specified as base_estimator. Looking the boxplot, one can say that the inliers data belong to dataset lying between minimum and maximum point.
The diagram given below represents what can be said as outliers and inliers.
- Mean Absolute Deviation (MAD): Median absolute deviation is measure of variability of observations from the median value of the observation. This will be used to select the inlier threshold to classify whether a data point is inlier or outlier. The choice of right value for MAD is problem specific and the challenge is to select the most appropriate value for MAD to have the model which generalizes well with unseen dataset.
RANSAC Regression Algorithm Details
Here are the details / steps of RANSAC regression algorithm.
- Select a random number of examples to be inliers and train the model.
- Test all other data points against the trained model
- Out of all the data points tested in step 2, select the points as inliers which fall within a user-given tolerance. In scikit-learn, median absolute deviation (MAD) is used for selecting the new points as inliers.
- Retrain the model with all inliers data
- Estimate the error of the retrained model versus the inliers.
- Follow step 1 to step 5
- Terminate the algorithm execution if the model performance meets a certain user-defined threshold or if a fixed number of iterations were reached
RANSAC Regression Python Code Example
Here is the Scikit-learn Python code for training / fitting a model using RANSAC regression algorithm implementation, RANSACRegressor. Pay attention to some of the following:
- Training dataset consist of just one feature which is average number of rooms per dwelling. However, you can use multiple features. The features to be used can be determined using correlation, multi-collinearity etc.
- Sklearn.linear_model RANSACRegressor is used for RANSAC algorithm implementation; Pay attention to attributes such as residual_threshold which is used to capture user-defined threshold. Different values of residual_threshold will result in different set of outliers.
- Sklearn Boston housing data set is used for fitting the model
from sklearn import datasets
from sklearn.preprocessing import StandardScaler
from sklearn.model_selection import train_test_split
from sklearn.linear_model import LinearRegression, RANSACRegressor
from sklearn.metrics import r2_score, mean_squared_error
import numpy as np
import matplotlib.pyplot as plt
import pandas as pd
#
# Load the Boston Housing dataset for training
#
bhd = datasets.load_boston()
df = pd.DataFrame(bhd.data)
df.columns = ['CRIM', 'ZN', 'INDUS', 'CHAS',
              'NOX', 'RM', 'AGE', 'DIS', 'RAD',
               'TAX', 'PTRATIO', 'B', 'LSTAT']
df['MEDV'] = bhd.target
#
# Select Avg. No of rooms per dwelling as feature
# and fit the model
#
X = df['RM'].to_numpy().reshape(-1, 1)
y = df['MEDV'].to_numpy().reshape(-1, 1)
#
# Create an instance of RANSACRegressor
#
ransac = RANSACRegressor(base_estimator=LinearRegression(),
                         min_samples=50, max_trials=100,
                         loss='absolute_loss', random_state=42,
                         residual_threshold=10)
#
# Fit the model
#
ransac.fit(X, y)
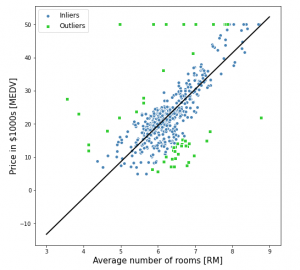
Using the fitted model, here is the plot demonstrating the inliers, outliers and the best fit line.

The Python code given below can be used to draw the above plot:
#
# Get the Inlier mask; Create outlier mask
#
inlier_mask = ransac.inlier_mask_
outlier_mask = np.logical_not(inlier_mask)
#
# Create scatter plot for inlier datset
#
plt.figure(figsize=(8, 8))
plt.scatter(X[inlier_mask], y[inlier_mask],
            c='steelblue', edgecolor='white',
            marker='o', label='Inliers')
#
# Create scatter plot for outlier datset
#
plt.scatter(X[outlier_mask], y[outlier_mask],
             c='limegreen', edgecolor='white',
             marker='s', label='Outliers')
#
# Draw the best fit line
#
line_X = np.arange(3, 10, 1)
line_y_ransac = ransac.predict(line_X[:, np.newaxis])
plt.plot(line_X, line_y_ransac, color='black', lw=2)
plt.xlabel('Average number of rooms [RM]', fontsize=15)
plt.ylabel('Price in $1000s [MEDV]', fontsize=15)
plt.legend(loc='upper left', fontsize=12)
plt.show()
Conclusions
Here is the summary of what you learned in this post in relation to RANSAC regression and how to fit a model using Sklearn RANSACRegressor implementation:
- RANSAC regression algorithm takes care of removing outliers from the training data set while fitting the model
- Some of the important hyper parameters for the RANSAC algorithm includes maximum number of iterations, minimum number of samples, loss function, residual threshold.
- Python Sklearn implementation of RANSAC regression takes into account median absolute deviation for handling inliers and outliers.
- RANSAC regression requires a base estimator to be set. With Python Sklearn implementation RANSACRegressor, the default base estimator is LinearRegression.

Check out my latest book titled as First Principles Thinking: Building winning products using first principles thinking.
- Coefficient of Variation in Regression Modelling: Example - November 9, 2025
- Chunking Strategies for RAG with Examples - November 2, 2025
- RAG Pipeline: 6 Steps for Creating Naive RAG App - November 1, 2025
I found it very helpful. However the differences are not too understandable for me