In this post, you will learn about the following:
- How to represent the probability that an event will take place with the asssociated features (attributes / independent features)
- Sigmoid function python code
Probability as Sigmoid Function
The below is the Logit Function code representing association between the probability that an event will occur and independent features.
$$Logit Function = \log(\frac{P}{(1-P)}) = {w_0} + {w_1}{x_1} + {w_2}{x_2} + …. + {w_n}{x_n}$$
$$Logit Function = \log(\frac{P}{(1-P)}) = W^TX$$
$$P = \frac{1}{1 + e^-W^TX}$$
The above equation can be called as sigmoid function.
Python Code for Sigmoid Function
import numpy as np
import matplotlib.pyplot as plt

# Sigmoid function
#
def sigmoid(z):
    return 1 / (1 + np.exp(-z))
# Creating sample Z points
#
z = np.arange(-5, 5, 0.1)

# Invoking Sigmoid function on all Z points
#
phi_z = sigmoid(z)

# Plotting the Sigmoid function
#
plt.plot(z, phi_z)
plt.axvline(0.0, color='k')
plt.xlabel('z')
plt.ylabel('$\phi(z)$')
plt.yticks([0.0, 0.5, 1.0])
ax = plt.gca()
ax.yaxis.grid(True)
plt.tight_layout()
plt.show()
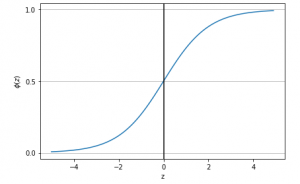
Executing the above code would result in the following plot:
Fig 1: Logistic Regression – Sigmoid Function Plot
Pay attention to some of the following in above plot:
- gca() function: Get the current axes on the current figure
- axvline() function: Draw the vertical line at the given value of X
- yticks() function: Get or set the current tick locations of the y-axis

I have been recently working in the area of Data analytics including Data Science and Machine Learning / Deep Learning. I am also passionate about different technologies including programming languages such as Java/JEE, Javascript, Python, R, Julia, etc, and technologies such as Blockchain, mobile computing, cloud-native technologies, application security, cloud computing platforms, big data, etc. I would love to connect with you on Linkedin.
Check out my latest book titled as First Principles Thinking: Building winning products using first principles thinking.
Check out my latest book titled as First Principles Thinking: Building winning products using first principles thinking.
Latest posts by Ajitesh Kumar (see all)
- Questions to Ask When Thinking Like a Product Leader - July 3, 2025
- Three Approaches to Creating AI Agents: Code Examples - June 27, 2025
- What is Embodied AI? Explained with Examples - May 11, 2025
nice