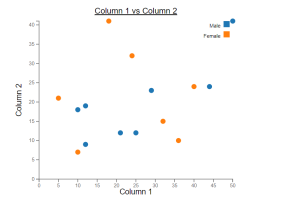
This online free tool, scatter plot creator, is designed to make data scatter plot visualization simpler, more efficient, and more integrated into your reporting. Scatter plots are invaluable for examining the relationship between two variables, identifying trends, outliers, and patterns. Whether you’re a data scientist, researcher, or data enthusiast, this tool will enable you to visualize your data effectively using scatter plots.
The following are key features of this online scatter plot maker tool:
- Directly paste data from Excel spreadsheet, or enter it manually.
- X-axis data field is essential for creating the scatter plot. Each data point represents a value on the X-axis.
- Y-axis data is crucial for plotting points vertically. Each data point corresponds to an X-axis value.
- Category data allows you to assign a category to each data point, which can be visualized in different colors on the scatter plot. This is particularly useful for comparing different groups or types within your dataset.
- A straightforward form (copy and paste from excel) allows easy input of X-axis, Y-axis, and optional category data.
- Automatic Labeling: Labels for axes are optional, with sensible defaults provided.
- Customizable Categories: Enhance your scatter plot with category data, adding depth and clarity to your analysis.
- User-Friendly Controls: Reset and create buttons make it simple to start over or generate your plot.
Create Scatter Plots
Latest posts by Ajitesh Kumar (see all)
- The Watermelon Effect: When Green Metrics Lie - January 25, 2026
- Coefficient of Variation in Regression Modelling: Example - November 9, 2025
- Chunking Strategies for RAG with Examples - November 2, 2025

I found it very helpful. However the differences are not too understandable for me