Have you ever wondered how you might determine the relationship between two sets of data that aren’t necessarily linear, or perhaps don’t adhere to the assumptions of other correlation measures? Enter the Spearman Rank Correlation Coefficient, a non-parametric statistic that offers robust insights into the monotonic relationship between two variables – perfect for dealing with ranked variables or exploring potential relationships in a new, exploratory dataset.
In this blog post, we will learn the concepts of Spearman correlation coefficient with the help of Python code examples. Understanding the concept can prove to be very helpful for data scientists. Whether you’re exploring associations in marketing data, results from a customer satisfaction survey, or anything in between, the Spearman correlation could be the key to unlocking the insights you need.
What’s Spearman Rank Correlation Coefficient?
The Spearman’s rank correlation coefficient, commonly referred to as Spearman’s rho, is a statistical measure of the strength and direction of the monotonic relationship between two ranked variables.
The Spearman Rank Correlation Coefficient, denoted as ρ (rho), is a non-parametric measure of statistical dependence between two variables. It assesses how well the relationship between two variables can be described using a monotonic function. In simpler terms, it measures the strength and direction of association between two ranked variables.
The following is the interpretation of value of Spearman coefficient:
- A Spearman correlation of 1 indicates a perfect positive correlation between the rank variables, i.e., as one variable increases, the other does as well.
- A Spearman correlation of -1 indicates a perfect negative correlation between the rank variables, i.e., as one variable increases, the other decreases.
- A Spearman correlation of 0 suggests no correlation, i.e., there’s no pattern that as one variable changes, the other does as well.
Let’s illustrate this concept with an example.
Suppose we have a small group of five friends who took part in a 5km running race and a swimming race. We can rank their performance in both events from 1 (best) to 5 (worst):
| Friend | Running Race Rank | Swimming Race Rank |
|---|---|---|
| A | 1 | 2 |
| B | 2 | 3 |
| C | 3 | 4 |
| D | 4 | 1 |
| E | 5 | 5 |
Now, we want to understand the correlation between their performances in the two races. Here, we can use the Spearman correlation coefficient.
To calculate the coefficient, we use the formula:
ρ = 1 – ( (6 * Σd²) / (n * (n² – 1)) )
Where:
- d is the difference between the two ranks for each individual
- n is the total number of observations (or friends in this case)
First, calculate the difference in ranks (d), square it (d²), and sum all the squared differences (Σd²).
| Friend | Running Rank (R1) | Swimming Rank (R2) | d = R1 – R2 | d² |
|---|---|---|---|---|
| A | 1 | 2 | -1 | 1 |
| B | 2 | 3 | -1 | 1 |
| C | 3 | 4 | -1 | 1 |
| D | 4 | 1 | 3 | 9 |
| E | 5 | 5 | 0 | 0 |
Σd² = 1 + 1 + 1 + 9 + 0 = 12
Now, substitute Σd² and n in the formula:
ρ = 1 – ( (6 * Σd²) / (n * (n² – 1)) )
ρ = 1 – ( (6 * 12) / (5 * (5² – 1)) )
ρ = 1 – (72 / 120)
ρ = 1 – 0.6
ρ = 0.4
So, the Spearman correlation coefficient of the friends’ ranks in the races is 0.4, indicating a moderate positive correlation.
Remember, the value of ρ ranges from -1 to 1. A positive ρ indicates a positive correlation (as one variable increases, the other tends to increase), and a negative ρ indicates a negative correlation (as one variable increases, the other tends to decrease). A value close to 0 indicates no correlation.
Spearman Correlation Coefficient: Real-life Examples
The Spearman correlation coefficient is a non-parametric measure that’s useful in a variety of real-life scenarios. Here are a few examples:
- Education: Imagine you are a teacher and want to find out if there’s a relationship between the ranking of students based on their homework scores and their final exam scores. As these are ranked data (and perhaps non-linear), the Spearman correlation could be an appropriate choice.
- Market Research: If a company wants to understand the correlation between the rank order of a customer’s income level and the rank order of the amount they spend on a product, Spearman’s correlation could be used.
- Psychology: In a survey or questionnaire, a psychologist might ask patients to rank their level of stress from 1-10 and also their level of anxiety from 1-10. To understand if there’s a correlation between these ranked responses, the Spearman correlation coefficient could be used.
- Environmental Science: Let’s say a scientist wants to understand the relationship between the ranking of cities based on air quality index and the ranking of cities based on incidence of respiratory diseases. As the relationship may not be linear and the data are ranks, the Spearman correlation would be a good choice.
- Medical Field: If a medical researcher is looking at the effectiveness of a new drug, they might rank patients based on how severe their symptoms are before taking the drug and then again after several weeks of taking the drug. To see if there’s a correlation in these rankings (indicating that the drug might be more effective for more severely afflicted patients), they could use the Spearman correlation coefficient.
Spearman correlation is most useful when the data are ranks or when you don’t want to make any assumptions about a linear relationship or normal distribution for the available data.
Spearman Rank Correlation Coefficient Python Example
The following represents a simple Python code snippet using the scipy library’s spearmanr function, which calculates the Spearman rank correlation coefficient. The data from previous example is used. The method spearmanr is invoked with the two lists of ranks as arguments. The method returns the correlation coefficient and the p-value. We’re only interested in the coefficient, so we ignore the p-value by assigning it to _.
from scipy.stats import spearmanr

# Ranks of friends in running and swimming
running_rank = [1, 2, 3, 4, 5]
swimming_rank = [2, 3, 4, 1, 5]

# Calculate Spearman's correlation
spearman_corr, _ = spearmanr(running_rank, swimming_rank)

print(f"Spearman's correlation coefficient is: {spearman_corr}")
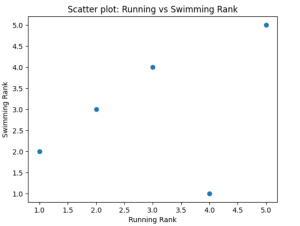
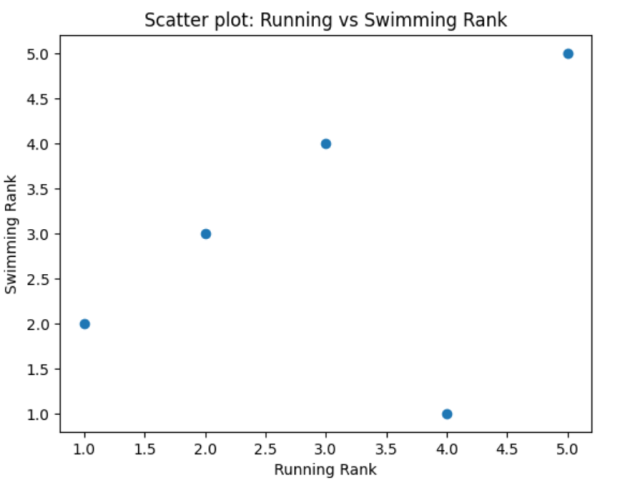
The correlation can also be seen as the following scatter plot:
Difference: Spearman Rank Correlation vs Pearson Correlation Coefficient
The following represents some of the key differences between Spearman rank correlation coefficient and Pearson correlation coefficient:
| . | Pearson Correlation Coefficient | Spearman Correlation Coefficient |
|---|---|---|
| Type of Data | Continuous, interval or ratio data, assumed to be normally distributed | Ordinal, interval, or ratio data; does not require a normal distribution |
| Assumptions | Assumes linearity and homoscedasticity (equal variance) in the data | No assumptions about the distribution and can handle non-linear relationships |
| Measures | Linear relationships | Monotonic (increasing or decreasing, but not necessarily at a constant rate) relationships |
| Calculation | Based on actual data values and their means | Based on data ranks |
| Appropriate Usage | When both variables are normally distributed and the relationship is linear | When data does not meet the assumption of normality or the relationship is non-linear |
Conclusion
The Spearman Rank Correlation Coefficient is a non-parametric measure that quantifies the degree of association between two ranked variables. This robust statistical tool provides an understanding of the monotonic relationship between these variables, allowing us to assess how well the relationship can be described using a monotonic function. Whether your data are ordinal or contain outliers, Spearman’s rank correlation has proven to be an effective measure, helping to glean insights from data that other correlation measures might miss.
The need for Spearman’s correlation arises primarily when dealing with non-linear relationships or when the data do not meet the assumptions required for Pearson’s correlation coefficient. This brings us to one of the key differences between the two: while Pearson’s correlation works with the actual data values and is most effective in determining linear relationships, Spearman’s correlation operates on the rank of data and efficiently uncovers monotonic relationships, whether linear or not.
If you would like to know about greater details, please feel free to reach out.
- The Watermelon Effect: When Green Metrics Lie - January 25, 2026
- Coefficient of Variation in Regression Modelling: Example - November 9, 2025
- Chunking Strategies for RAG with Examples - November 2, 2025


I found it very helpful. However the differences are not too understandable for me